
Yerevan Elections: Possible Fraud and Disproportionalities
The preliminary results from all 475 polling stations in the Yerevan City Council elections have been summarized. According to the published data, five political forces have crossed the necessary threshold to be elected to the Yerevan City Council.
A total of 75,463 voters cast their ballots for the Civil Contract (ՔՊ), comprising 32.57% of participants. “National Progress” is in second place with 18.89% (43,765 votes), followed by “Mother Armenia” in third with 15.43% (35,739 votes). “Republic” received 11.32% of votes (26,236), and “Public Voice” is fifth, for which 9.68% of participants voted (22,431).
234,553 citizens, or 28.46% of voters, participated in the Yerevan City Council elections.
Investigating the Degree of Fraud
Let’s examine the disproportionalities and the degree of probability of fraud in the elections.
The general methodology is based on the relationship between the number of participants and the percentage of votes collected for a specific candidate. Data was taken from the website of the Central Election Commission of the Republic of Armenia, which you can download via the following link: Voting results by polling stations. The code for the calculations and plots is available on this website: github.com. This material is also available on the tvyal.com website. To conduct the study, two main indicators were calculated: the percentage of votes given to a particular party among voters, and the percentage of voter turnout. If these two indicators do not have a level of dependency, then the elections have most likely been free and without fraud. For example, if in any electoral district 95 percent of voters participated in the election and also gave 95 percent of their votes to a certain party, while these indicators are close to 50 percent in the overall distribution, then this raises questions.
The table presents the 5 candidates who crossed the threshold, their vote counts, percentage share, and correlation. The last column shows the correlation between the percentage of votes given to a particular party among voters and the percentage of voter turnout.
Table 1. Indicators of candidates who crossed the threshold
| Candidate | votes | percentage | correlation |
|---|---|---|---|
| 1. Public Voice Party | 22 431 | 9.69% | -0.184 |
| 2. Civil Contract Party | 75 463 | 32.60% | -0.329 |
| 7. National Progress Party | 43 765 | 18.91% | 0.016 |
| 9. Republic Party | 26 236 | 11.33% | 0.118 |
| 14. Mother Armenia Alliance of Parties | 35 739 | 15.44% | 0.390 |
Here, candidates #2 (Civil Contract) and #14 (Mother Armenia Alliance of Parties) show the largest deviations, with correlations of -0.329 and 0.390, respectively.
Let’s examine these indicators through a chart.
Plot 1. Distributions of candidates who crossed the threshold
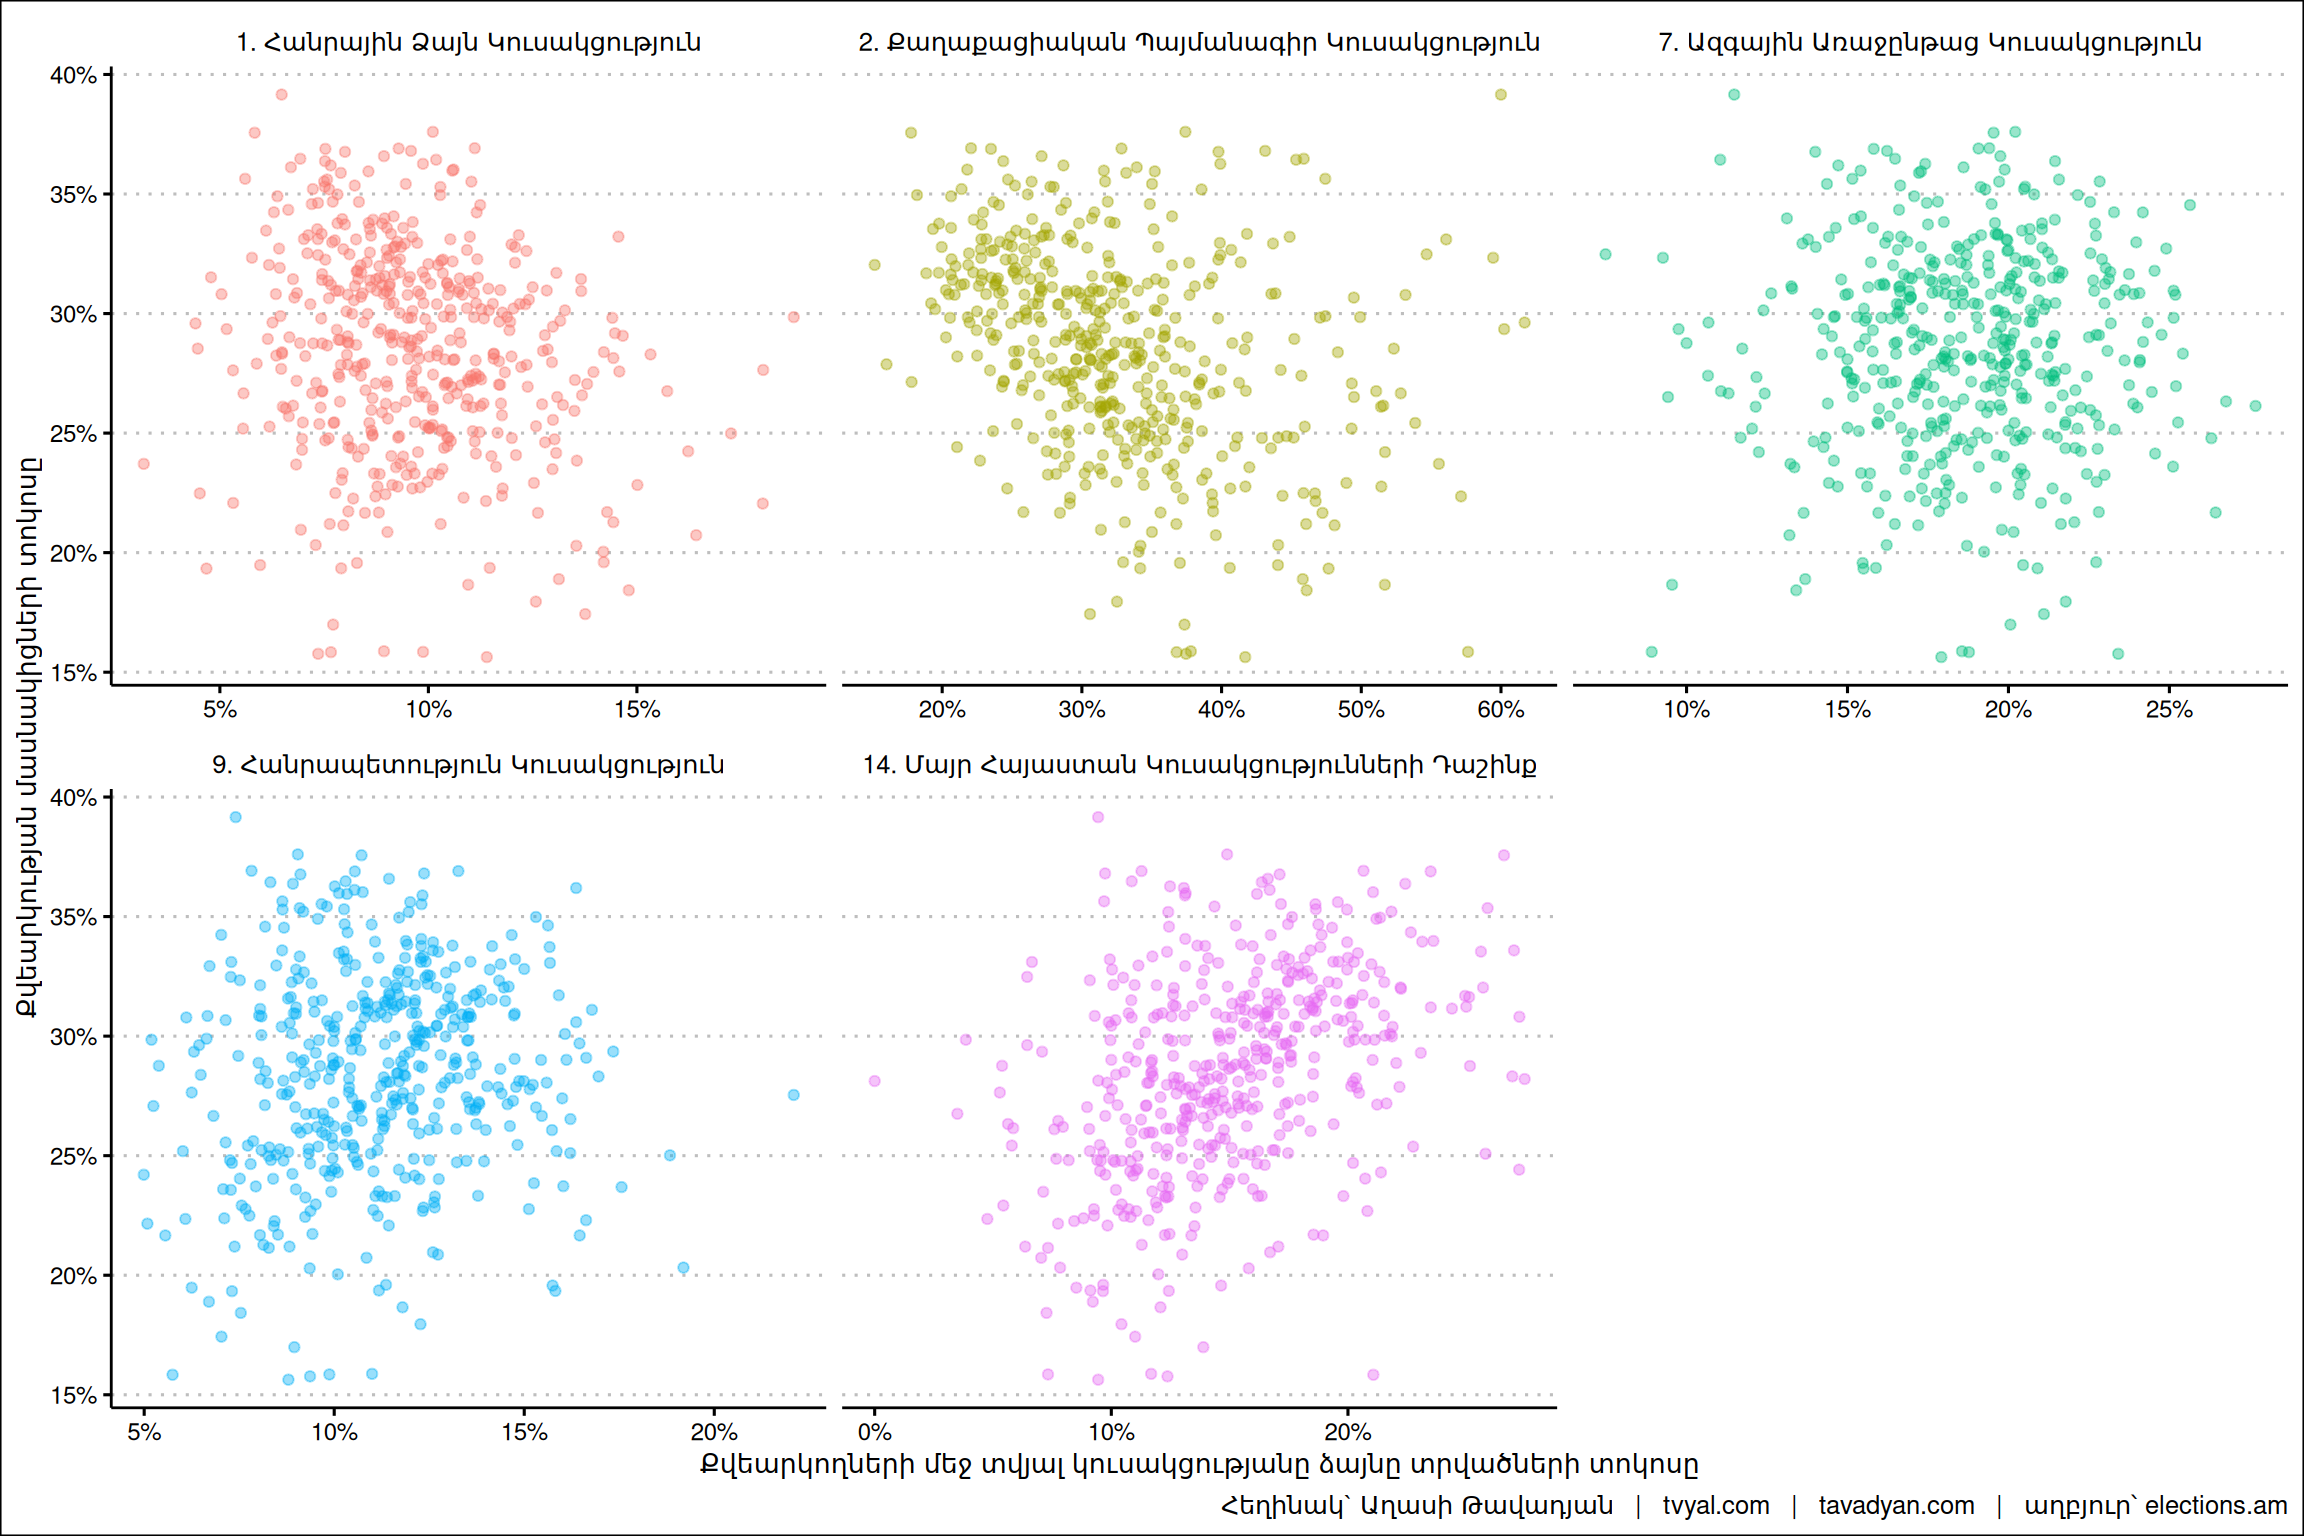
Candidate #2 registered a negative correlation coefficient of -0.329. This indicates that as the percentage of participants in an electoral district increases, the percentage of votes for candidate #2 decreases. In other words, in districts with higher voter turnout, this candidate garnered fewer votes. This means candidate #2’s support decreases as an electoral district becomes more active.
Candidate #14 shows the opposite trend, having registered a positive correlation of 0.390. This indicates that as the percentage of participants in an electoral district increases, the percentage of votes for this candidate also tends to increase. This could be due to higher voter turnout in regions where this party enjoys greater support.
For candidate #7 (National Progress Party), the correlation is closest to 0, which means that the relationship between voters and votes cast for this candidate is consistent and independent.
We should note that absolute correlations close to 0.4 do not necessarily mean that fraud occurred during the elections. The overall distributions appear normal, are symmetrical, and have a clear peak, which suggests that stuffing and fraud most likely did not take place.
Assessment of Electoral District Activity
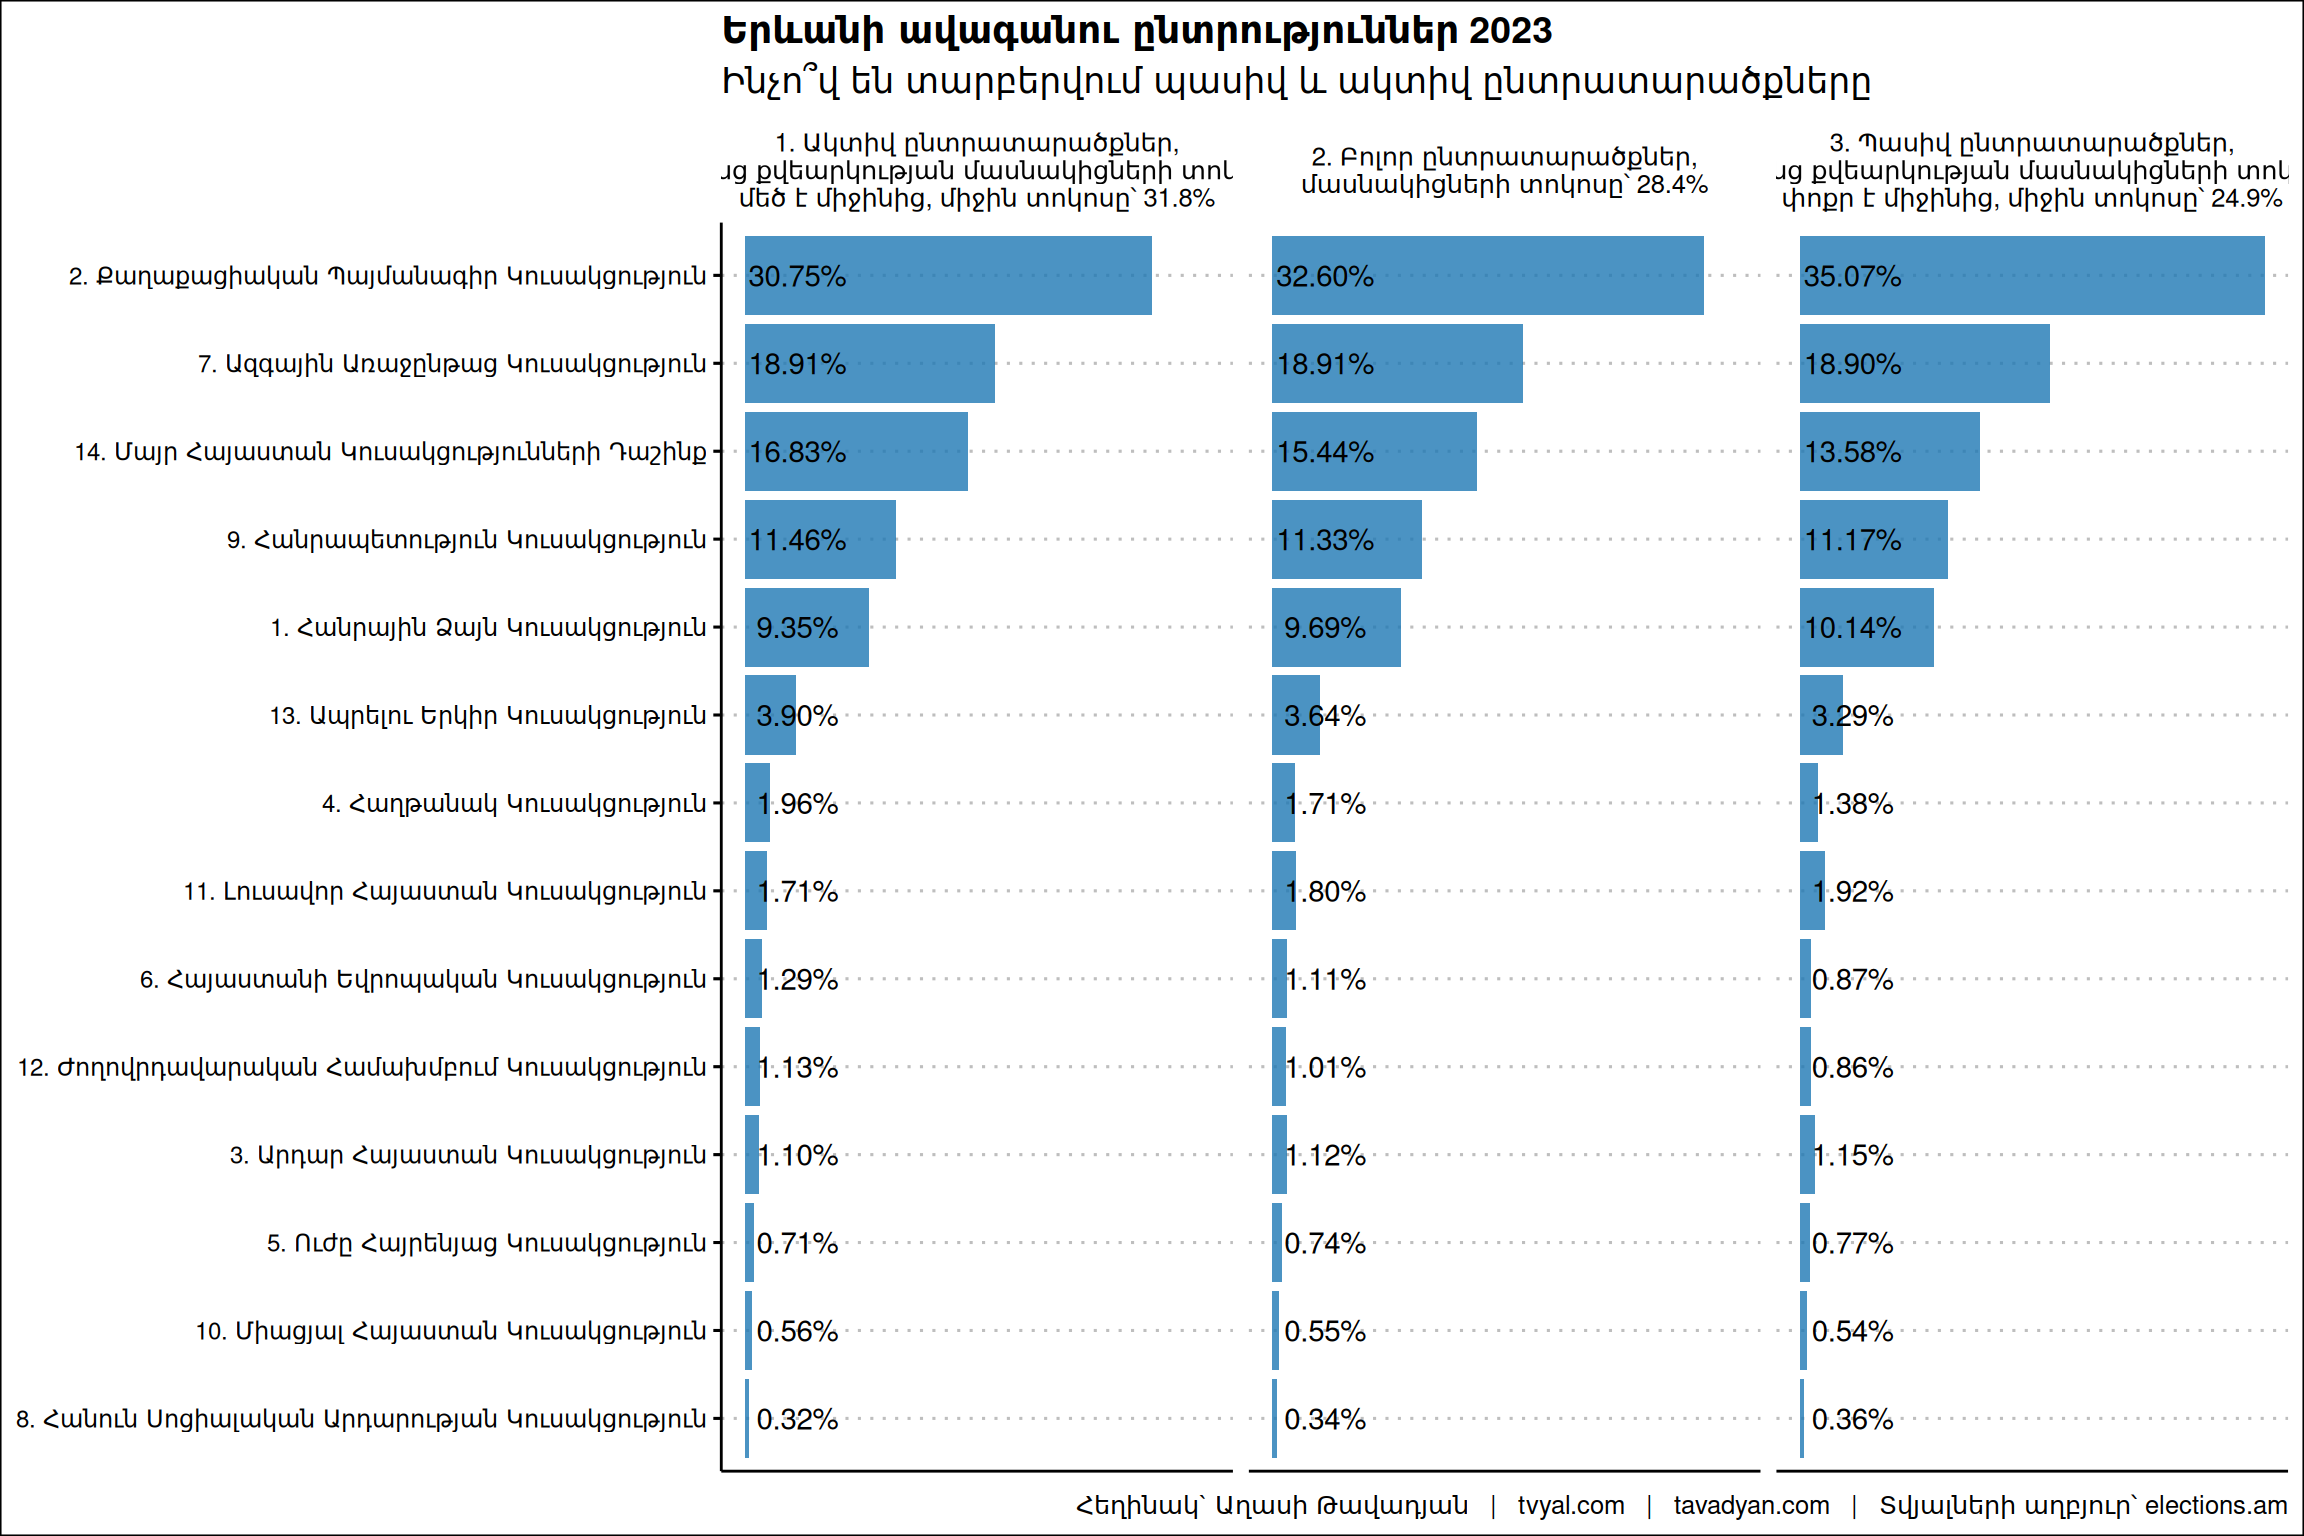
In active electoral districts, Civil Contract (ՔՊ) garnered 2% fewer votes, while in passive electoral districts, conversely, it received 2.5% more votes.
In all electoral districts, 28.4% of eligible voters participated in the elections. In active electoral districts, where voter turnout was above average, the average turnout percentage was 31.8%. In passive electoral districts, the average turnout percentage was 24.9%.
As can be seen from the plot, in passive electoral districts, candidate #2 received 35.07% of the votes, and 30.75% in active electoral districts. Conversely, candidate #14 received 13.58% of the votes in passive electoral districts, and 16.68% in active electoral districts.
English summary. Yerevan Elections: Investigating Fraud and Voter Disproportionality
The preliminary results from all 475 polling stations in the Yerevan City Council elections have been summarized. According to the published data, five political forces have crossed the necessary threshold to be elected to the Yerevan City Council.
A total of 75,463 voters cast their ballots for the Civil Contract (ՔՊ), comprising 32.57% of participants. “National Progress” is in second place with 18.89% (43,765 votes), followed by “Mother Armenia” in third with 15.43% (35,739 votes). “Republic” received 11.32% of votes (26,236), and “Public Voice” is fifth, for which 9.68% of participants voted (22,431).
234,553 citizens, or 28.46% of voters, participated in the Yerevan City Council elections.
Investigating the Degree of Fraud
Let’s examine the disproportionalities and the degree of probability of fraud in the elections.
The general methodology is based on the relationship between the number of participants and the percentage of votes collected for a specific candidate. Data was taken from the website of the Central Election Commission of the Republic of Armenia, which you can download via the following link: Voting results by polling stations. The code for the calculations and plots is available on this website: github.com. This material is also available on the tvyal.com website. To conduct the study, two main indicators were calculated: the percentage of votes given to a particular party among voters, and the percentage of voter turnout. If these two indicators do not have a level of dependency, then the elections have most likely been free and without fraud. For example, if in any electoral district 95 percent of voters participated in the election and also gave 95 percent of their votes to a certain party, while these indicators are close to 50 percent in the overall distribution, then this raises questions.
The table presents the 5 candidates who crossed the threshold, their vote counts, percentage share, and correlation. The last column shows the correlation between the percentage of votes given to a particular party among voters and the percentage of voter turnout.
Table 1. Indicators of candidates who crossed the threshold
| Candidate | votes | percentage | correlation |
|---|---|---|---|
| 1. Public Voice Party | 22 431 | 9.69% | -0.184 |
| 2. Civil Contract Party | 75 463 | 32.60% | -0.329 |
| 7. National Progress Party | 43 765 | 18.91% | 0.016 |
| 9. Republic Party | 26 236 | 11.33% | 0.118 |
| 14. Mother Armenia Alliance of Parties | 35 739 | 15.44% | 0.390 |
Here, candidates #2 (Civil Contract) and #14 (Mother Armenia Alliance of Parties) show the largest deviations, with correlations of -0.329 and 0.390, respectively.
Let’s examine these indicators through a chart.
Plot 1. Distributions of candidates who crossed the threshold
Candidate #2 registered a negative correlation coefficient of -0.329. This indicates that as the percentage of participants in an electoral district increases, the percentage of votes for candidate #2 decreases. In other words, in districts with higher voter turnout, this candidate garnered fewer votes. This means candidate #2’s support decreases as an electoral district becomes more active.
Candidate #14 shows the opposite trend, having registered a positive correlation of 0.390. This indicates that as the percentage of participants in an electoral district increases, the percentage of votes for this candidate also tends to increase. This could be due to higher voter turnout in regions where this party enjoys greater support.
For candidate #7 (National Progress Party), the correlation is closest to 0, which means that the relationship between voters and votes cast for this candidate is consistent and independent.
We should note that absolute correlations close to 0.4 do not necessarily mean that fraud occurred during the elections. The overall distributions appear normal, are symmetrical, and have a clear peak, which suggests that stuffing and fraud most likely did not take place.
Assessment of Electoral District Activity
In active electoral districts, Civil Contract (ՔՊ) garnered 2% fewer votes, while in passive electoral districts, conversely, it received 2.5% more votes.
In all electoral districts, 28.4% of eligible voters participated in the elections. In active electoral districts, where voter turnout was above average, the average turnout percentage was 31.8%. In passive electoral districts, the average turnout percentage was 24.9%.
As can be seen from the plot, in passive electoral districts, candidate #2 received 35.07% of the votes, and 30.75% in active electoral districts. Conversely, candidate #14 received 13.58% of the votes in passive electoral districts, and 16.68% in active electoral districts.