Russia's Federal Budget Execution
This message is a continuation of our previous two messages:
- The State of the Russian Economy and its Potential Impact on the Region, 2023-10-03
- The Russian Ruble is Set to Strengthen. Potential Flow of Foreign Currency from Russia to Armenia, 2023-10-16
The study of the Russian economy, as presented, is vital for Armenia for several reasons: Firstly, approximately 55 percent of Armenia’s exports currently go to the Russian Federation, and a potential strengthening of the ruble could impact economic activity, exports, and other economic indicators. Additionally, recent Russian policies aimed at increasing the amount of foreign currency in its market could ensure a significant influx of Russian capital into Armenia. This could serve as a stimulus for Armenia’s economy and banking system, which is particularly important given the country’s current economic challenges. Therefore, research into Russia’s economic trends is extremely important for Armenia, as it directly affects foreign currency flows and other economic indicators. More details in section 2.
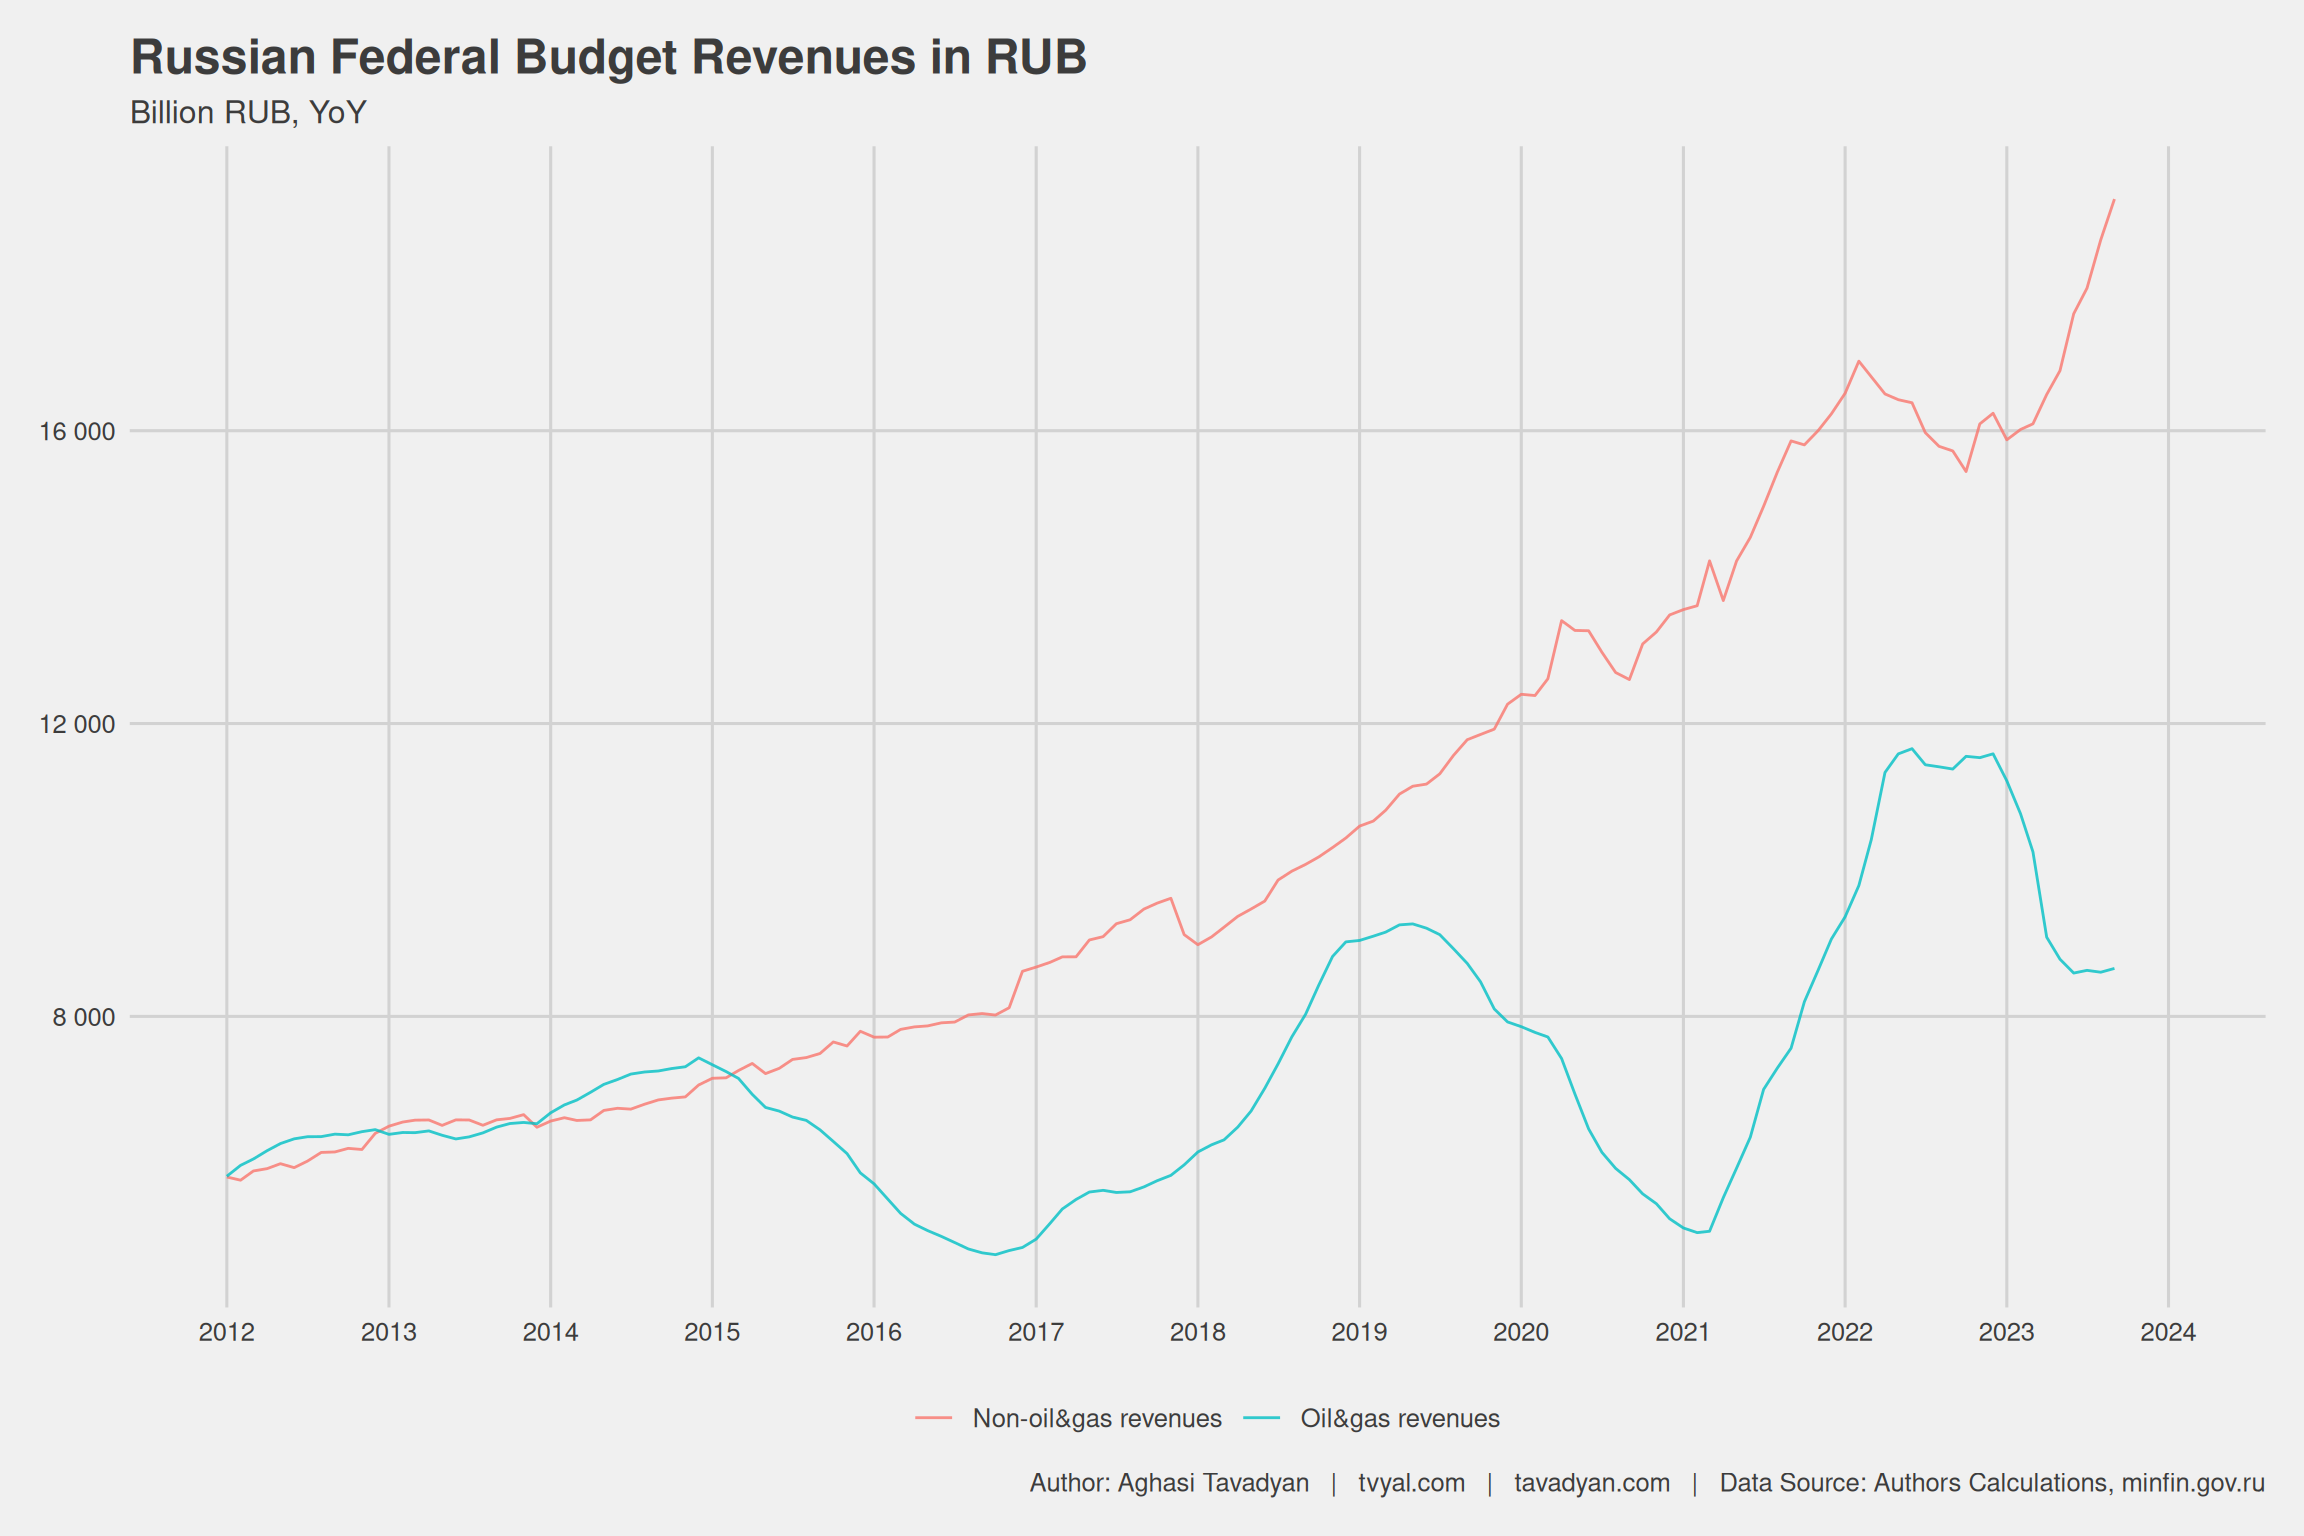
Chart 1 examines the continuous growth of Russian Federation budget revenues in rubles. Until 2015, the primary source of income for Russia was the sale of gas and oil products. However, with the decline in global oil prices in 2015, the country’s revenue profile began to diversify, driven by a growing share of non-oil revenues. Notably, revenues from oil and gas exhibit a cyclical nature, reflecting fluctuations in gas prices. The decline in 2020 was primarily due to the COVID-19 pandemic, and revenues further decreased in 2022 due to sanctions imposed against Russia.
Chart 1. Dynamics of Russia’s Budget Revenues (billion rubles, annual indicator)
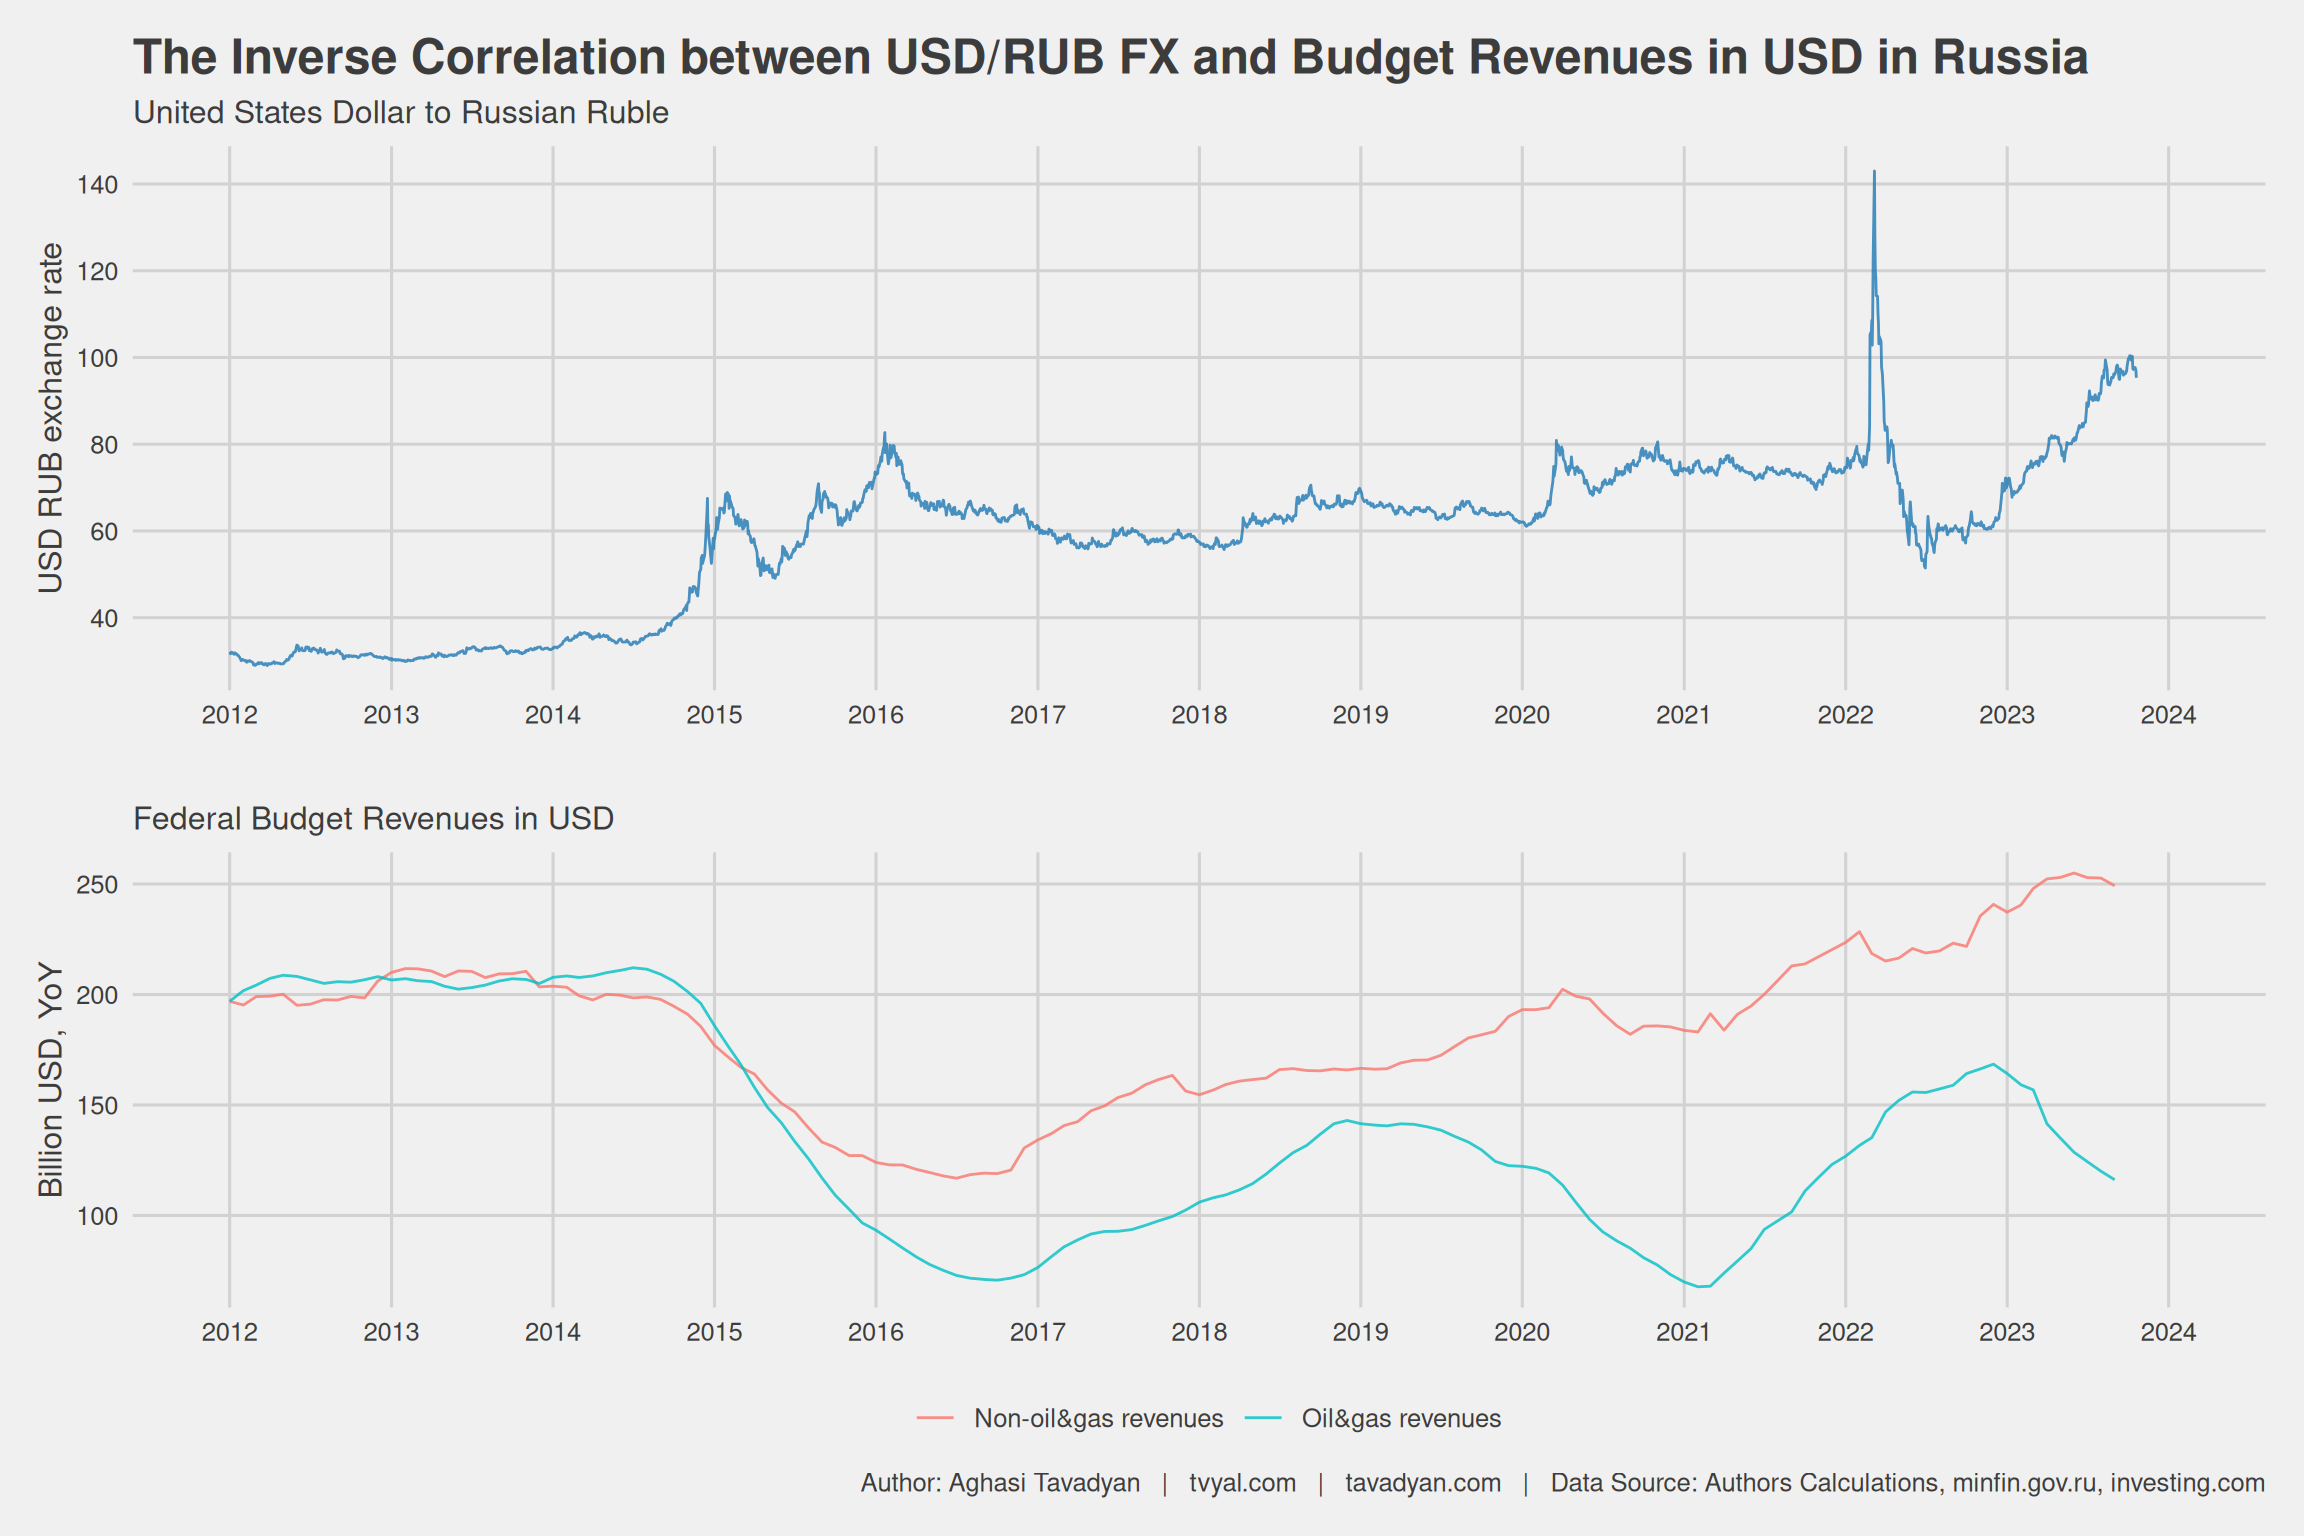
The second chart presents a comparison between dollar revenues and the ruble exchange rate, shedding light on certain issues. Here, monthly ruble revenues were divided by the average exchange rate for the respective month, and the resulting indicator was summed over the preceding 12 months.
The upper part of the chart shows the USD/RUB exchange rate, while the lower part displays the Russian Federation’s budget revenues, on an annual basis and expressed in dollars. The revenue data is divided into two parts: income from oil products and gas, and income from non-oil products. This chart reveals how sensitively the Russian ruble exchange rate is affected, particularly by revenues from oil product exports.
Thus, when dollar revenues decrease, the ruble tends to depreciate, leading to an overall increase in the Russian budget in rubles, and conversely, when oil product prices rise, the ruble tends to appreciate. Until 2015, the exchange rate hovered around 1 US dollar, equating to approximately 35 rubles. During this period, dollar revenues from oil and gas sales were significantly higher. In 2014, one barrel of oil cost about 120 dollars, but in 2016, it dropped to around 50 dollars, leading to a sharp decline in Russia’s dollar revenues and a corresponding depreciation of the ruble. 2020, marked by the COVID-19 pandemic, did not have a significant impact on the ruble exchange rate. However, in 2023, oil prices rose due to artificial demand restrictions imposed by “OPEC+”, while sanctions against Russia led to a sharp reduction in oil production revenues, causing a significant fall in the exchange rate.
Chart 2. Dynamics of the Ruble Exchange Rate and Russian Federation Budget Revenues (billion USD, annual indicator).
The third chart shows a significant inverse correlation between the USD/ruble exchange rate and the Russian Federation’s budget revenues expressed in USD. Here, the linear correlation coefficient is -0.515, indicating a strong negative relationship. Currently, Russia aims to strengthen the ruble exchange rate, striving for an exchange rate of 90 rubles per 1 US dollar, while simultaneously increasing budget revenues. These goals present a significant challenge for Russia, as these two objectives are inversely correlated, as illustrated in the chart.
Chart 3. Inverse Correlation between the Russian Ruble Exchange Rate and Budgetary Revenues in USD
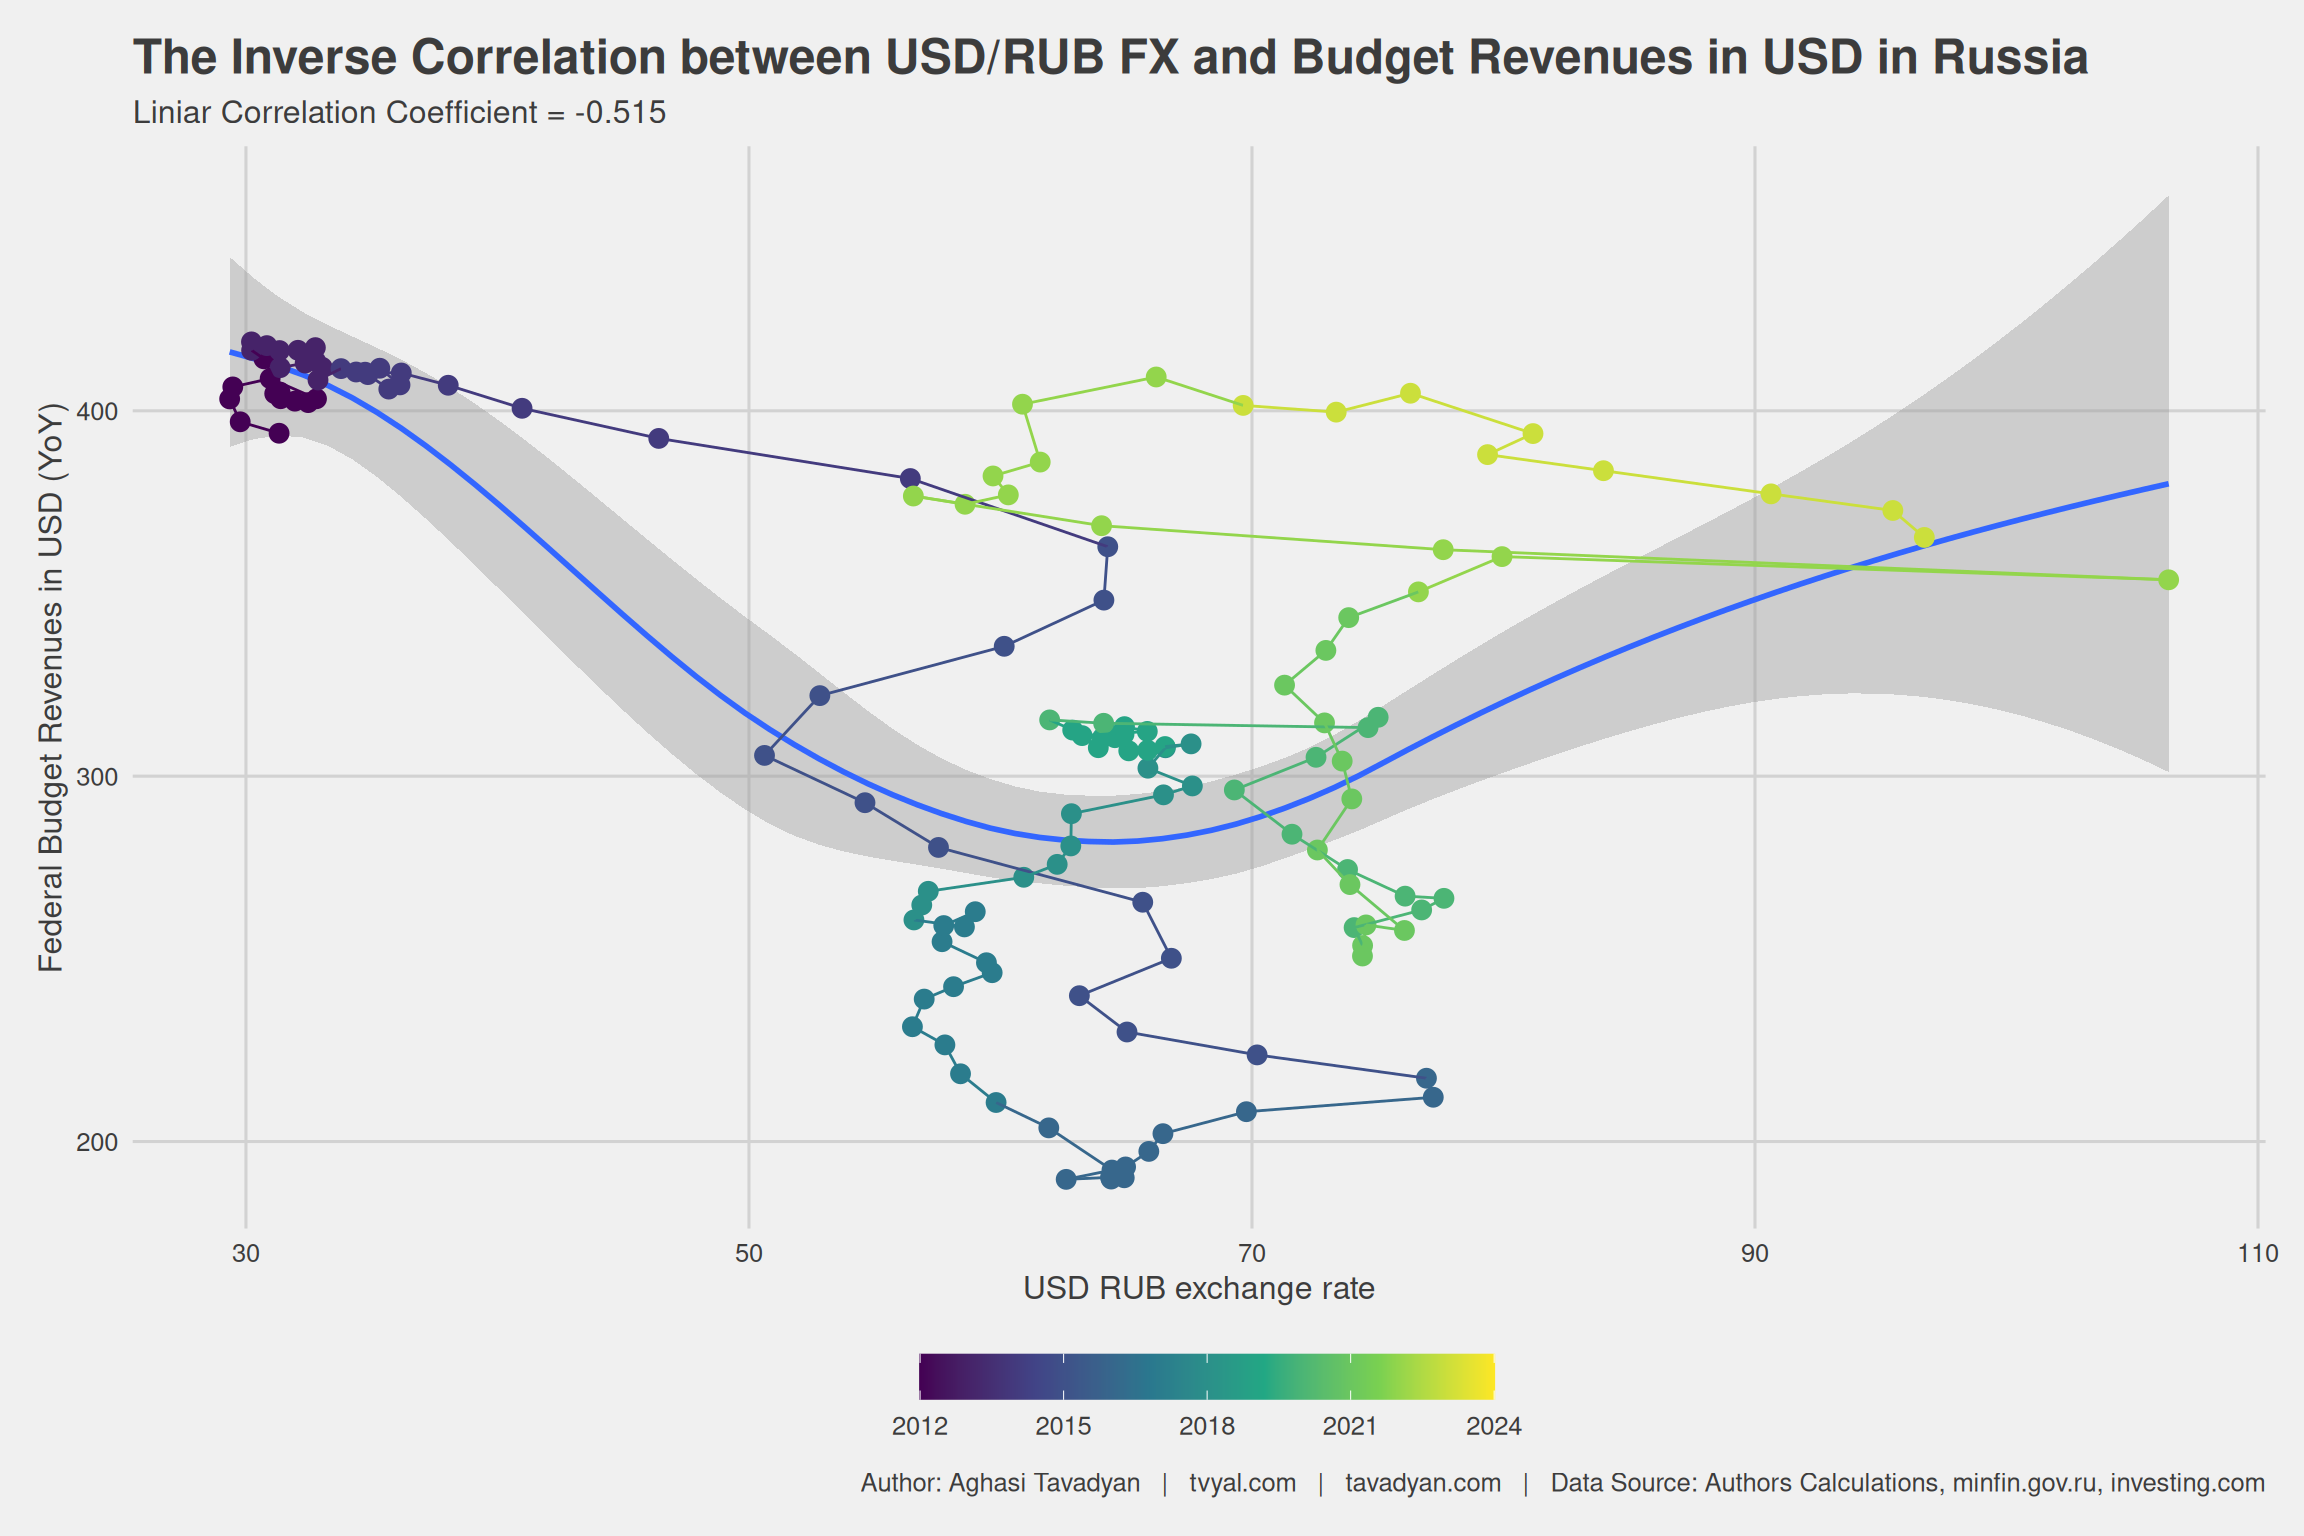
Chart 4 shows the 12-month ratio of Russia’s income to expenditure. Currently, it is evident that Russia is spending more than it earns in income. However, as of September 2023, this ratio already shows an upward trend, which may indicate a possible improvement in the financial balance in the near future.
Chart 4. Ratio of Russia’s Budgetary Revenues and Expenditures.
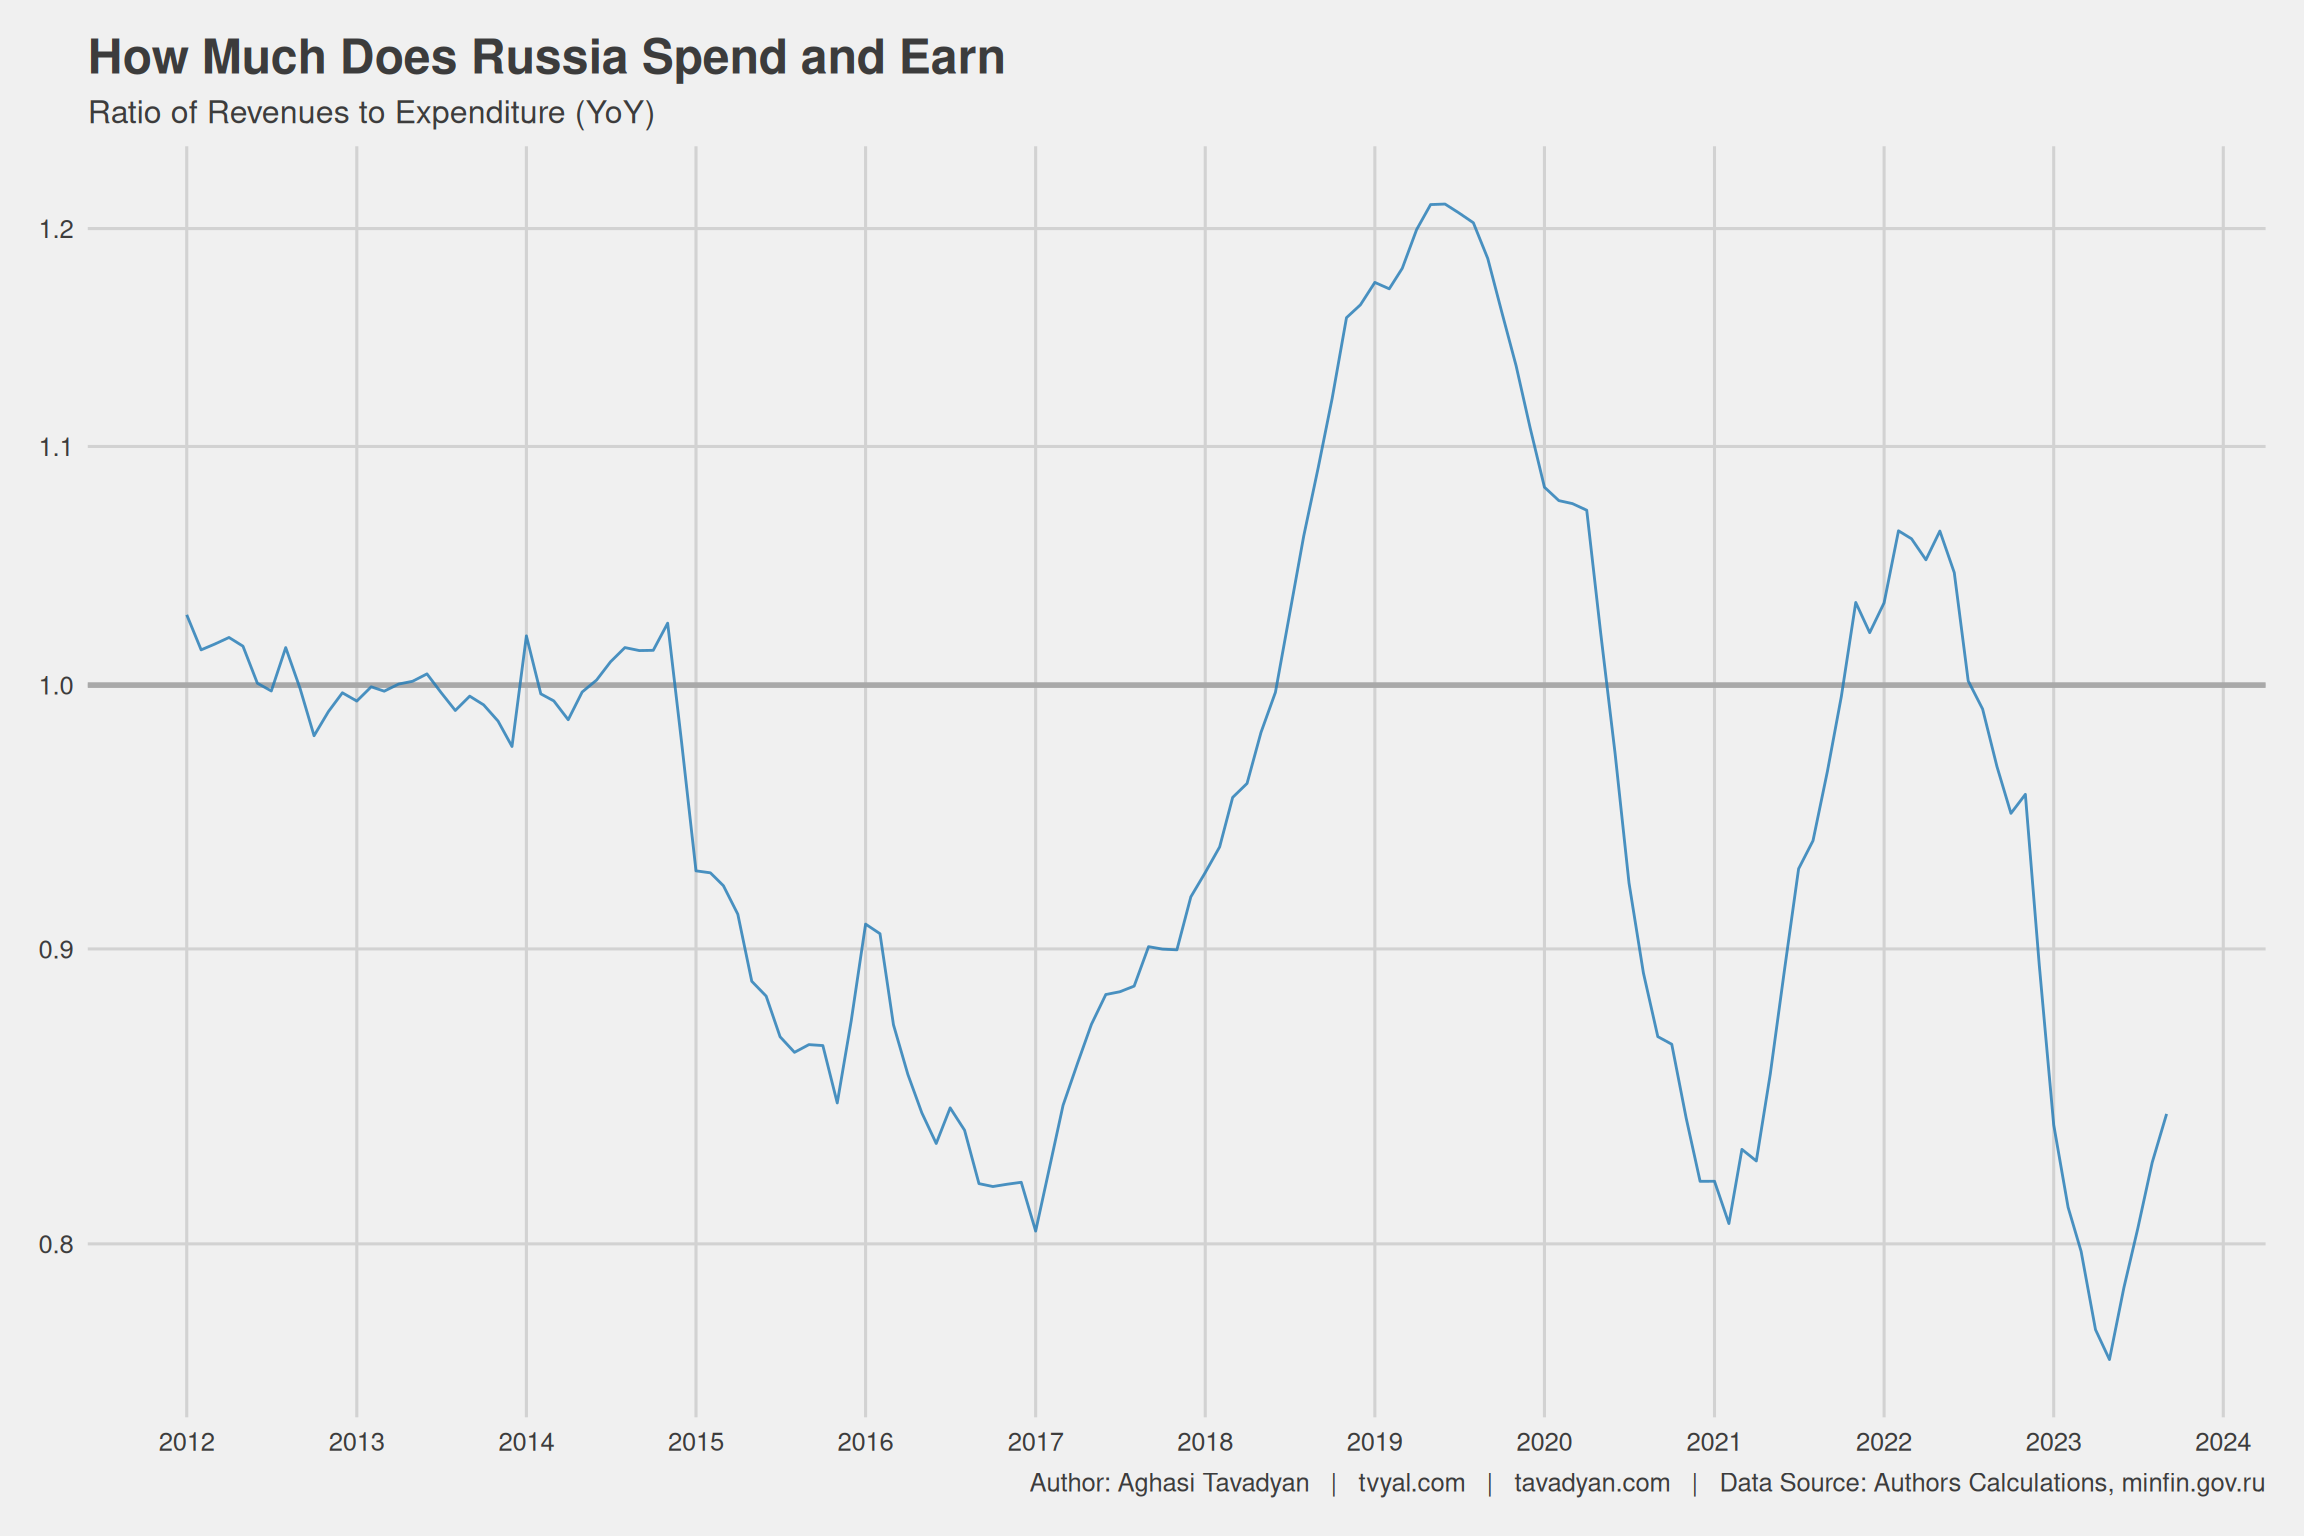
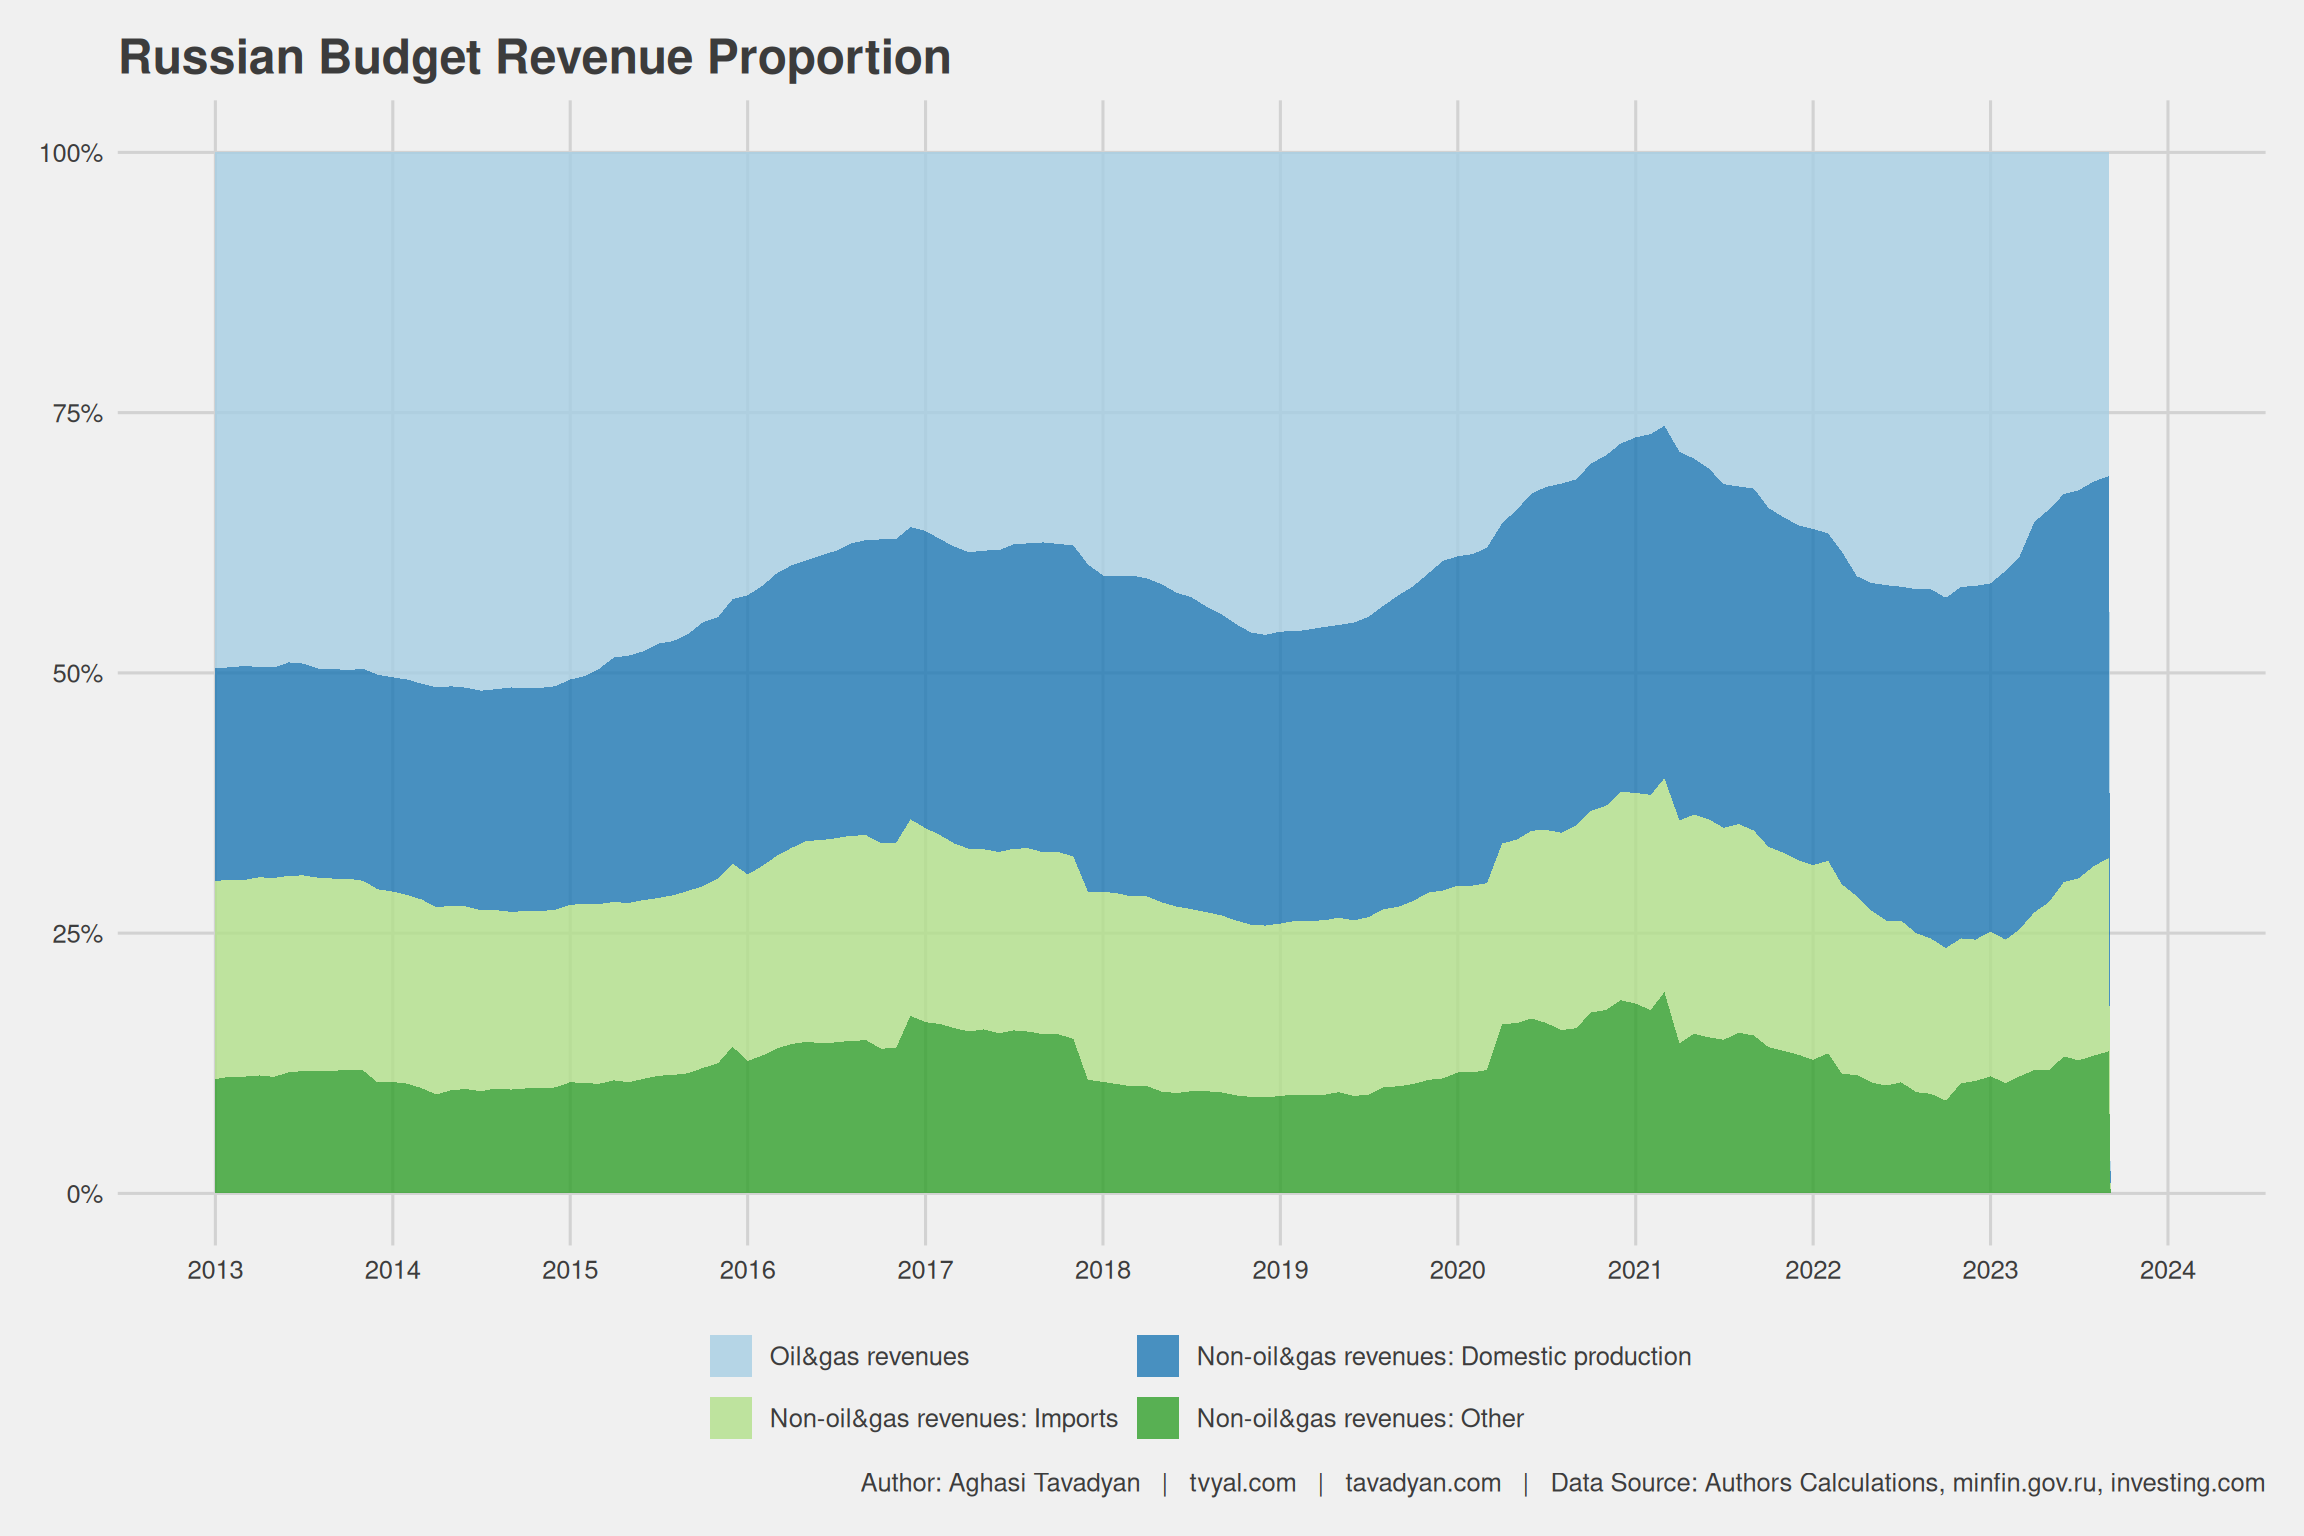
Chart 5 reflects the composition of Russia’s budget revenues, distinguishing between revenues from oil and gas products and non-oil and gas products. Until 2015, approximately 50% of revenues came from oil and gas sources, whereas by September 2023, this proportion had decreased to 35%. It is important to note that this pattern exhibits cyclicality, and from mid-2023, it may be approaching a cyclical peak.
Chart 5. Composition of Russia’s Budget Revenues.
Considering this cyclicality and the Russian Federation’s dual, contradictory goals, namely ruble appreciation and simultaneously increasing revenues from oil and gas sales, it is probable that over the next year, Russia may establish itself in new markets, which could lead to an increase in revenues from the sale of oil products and gas.
Media Communications, What to Expect
This week, I gave an interview to 1in.am about the Russian ruble exchange rate forecast and potential economic changes in Armenia.
The interviews will provide answers to the following questions:
- The Russian Ruble is Set to Strengthen. Potential Flow of Foreign Currency from Russia to Armenia.
- Analysis of International Money Transfers from Armenia.
- What is the connection between Russia’s economic crisis and Artsakh?
- What new shocks and positive impulses might await Armenia?
- What awaits us?
- What to do to strengthen the economy and the state?
To learn more about this issue, watch the interview:

English Summary
This message is a continuation of our previous two messages:
- The State of the Russian Economy and its Potential Impact on the Region, 2023-10-03
- The Russian Ruble is Set to Strengthen. Potential Flow of Foreign Currency from Russia to Armenia, 2023-10-16
The study of the Russian economy, as presented, is vital for Armenia for several reasons: Firstly, approximately 55 percent of Armenia’s exports currently go to the Russian Federation, and a potential strengthening of the ruble could impact economic activity, exports, and other economic indicators. Additionally, recent Russian policies aimed at increasing the amount of foreign currency in its market could ensure a significant influx of Russian capital into Armenia. This could serve as a stimulus for Armenia’s economy and banking system, which is particularly important given the country’s current economic challenges. Therefore, research into Russia’s economic trends is extremely important for Armenia, as it directly affects foreign currency flows and other economic indicators. More details in section 2.
Chart 1 examines the continuous growth of Russian Federation budget revenues in rubles. Until 2015, the primary source of income for Russia was the sale of gas and oil products. However, with the decline in global oil prices in 2015, the country’s revenue profile began to diversify, driven by a growing share of non-oil revenues. Notably, revenues from oil and gas exhibit a cyclical nature, reflecting fluctuations in gas prices. The decline in 2020 was primarily due to the COVID-19 pandemic, and revenues further decreased in 2022 due to sanctions imposed against Russia.
Chart 1. Dynamics of Russia’s Budget Revenues (billion rubles, annual indicator)
The second chart presents a comparison between dollar revenues and the ruble exchange rate, shedding light on certain issues. Here, monthly ruble revenues were divided by the average exchange rate for the respective month, and the resulting indicator was summed over the preceding 12 months.
The upper part of the chart shows the USD/RUB exchange rate, while the lower part displays the Russian Federation’s budget revenues, on an annual basis and expressed in dollars. The revenue data is divided into two parts: income from oil products and gas, and income from non-oil products. This chart reveals how sensitively the Russian ruble exchange rate is affected, particularly by revenues from oil product exports.
Thus, when dollar revenues decrease, the ruble tends to depreciate, leading to an overall increase in the Russian budget in rubles, and conversely, when oil product prices rise, the ruble tends to appreciate. Until 2015, the exchange rate hovered around 1 US dollar, equating to approximately 35 rubles. During this period, dollar revenues from oil and gas sales were significantly higher. In 2014, one barrel of oil cost about 120 dollars, but in 2016, it dropped to around 50 dollars, leading to a sharp decline in Russia’s dollar revenues and a corresponding depreciation of the ruble. 2020, marked by the COVID-19 pandemic, did not have a significant impact on the ruble exchange rate. However, in 2023, oil prices rose due to artificial demand restrictions imposed by “OPEC+”, while sanctions against Russia led to a sharp reduction in oil production revenues, causing a significant fall in the exchange rate.
Chart 2. Dynamics of the Ruble Exchange Rate and Russian Federation Budget Revenues (billion USD, annual indicator).
The third chart shows a significant inverse correlation between the USD/ruble exchange rate and the Russian Federation’s budget revenues expressed in USD. Here, the linear correlation coefficient is -0.515, indicating a strong negative relationship. Currently, Russia aims to strengthen the ruble exchange rate, striving for an exchange rate of 90 rubles per 1 US dollar, while simultaneously increasing budget revenues. These goals present a significant challenge for Russia, as these two objectives are inversely correlated, as illustrated in the chart.
Chart 3. Inverse Correlation between the Russian Ruble Exchange Rate and Budgetary Revenues in USD
Chart 4 shows the 12-month ratio of Russia’s income to expenditure. Currently, it is evident that Russia is spending more than it earns in income. However, as of September 2023, this ratio already shows an upward trend, which may indicate a possible improvement in the financial balance in the near future.
Chart 4. Ratio of Russia’s Budgetary Revenues and Expenditures.
Chart 5 reflects the composition of Russia’s budget revenues, distinguishing between revenues from oil and gas products and non-oil and gas products. Until 2015, approximately 50% of revenues came from oil and gas sources, whereas by September 2023, this proportion had decreased to 35%. It is important to note that this pattern exhibits cyclicality, and from mid-2023, it may be approaching a cyclical peak.
Chart 5. Composition of Russia’s Budget Revenues.
Considering this cyclicality and the Russian Federation’s dual, contradictory goals, namely ruble appreciation and simultaneously increasing revenues from oil and gas sales, it is probable that over the next year, Russia may establish itself in new markets, which could lead to an increase in revenues from the sale of oil products and gas.
This week, I gave an interview to 1in.am about the Russian ruble exchange rate forecast and potential economic changes in Armenia.
The interviews will provide answers to the following questions:
- The Russian Ruble is Set to Strengthen. Potential Flow of Foreign Currency from Russia to Armenia.
- Analysis of International Money Transfers from Armenia.
- What is the connection between Russia’s economic crisis and Artsakh?
- What new shocks and positive impulses might await Armenia?
- What awaits us?
- What to do to strengthen the economy and the state?
To learn more about this issue, watch the interview: