Analysis of RA Trade Turnover
The aim of this week’s newsletter is to highlight Armenia’s trade turnover directions. This material aims to shed light on where and what we export, and what potential our ready, high-value-added products have abroad.
Statistical data and code for this, as well as other materials published by us, are available; see the GitHub link below.
1.1. Armenia’s Trade with Russia in a Few Words
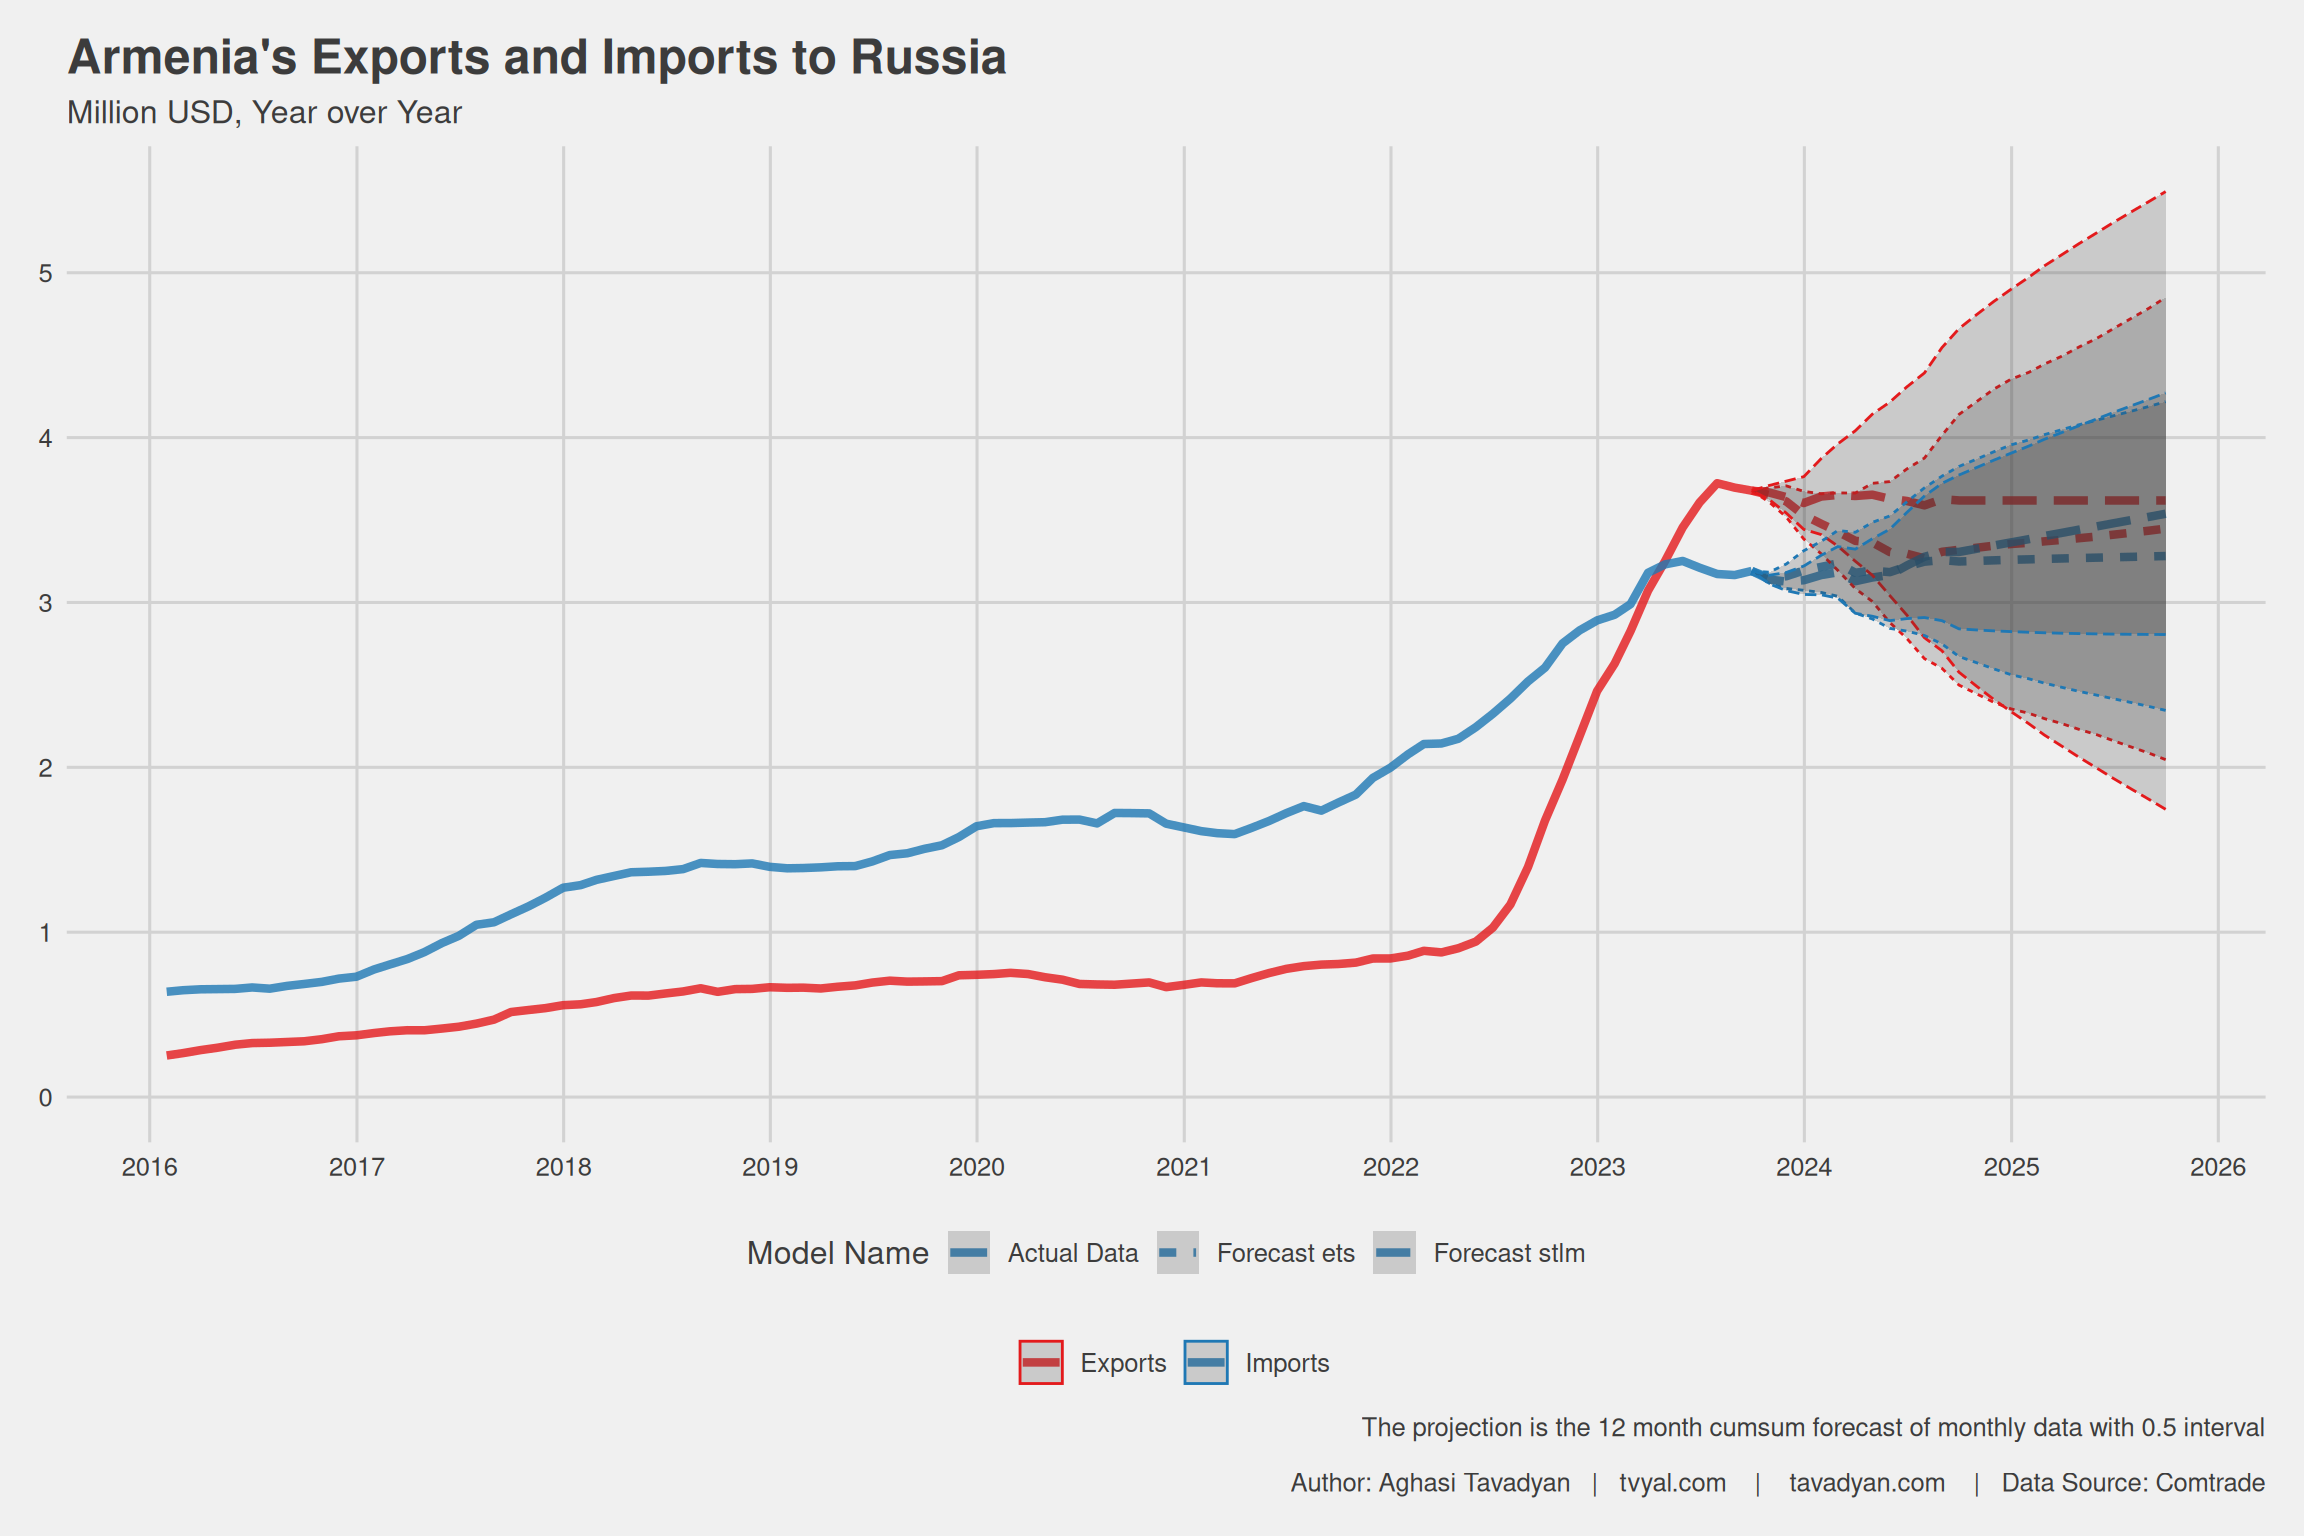
As of September 2023, Armenia exports 24 percent more goods to Russia than it imports. In the 12 months leading up to September 2023, goods worth 3.68 billion USD were exported, while goods worth 2.97 billion USD were imported. More than 52 percent (over half) of total exports go to Russia, primarily consisting of high-value-added final products; see Figure 1.
Considering this circumstance, it can be argued that, at present, Russia’s economy is somewhat more dependent on Armenia.
In 2021, annual exports amounted to 841 million USD, while imports were about 2 times higher, at 1.79 billion USD. Currently, the relationship is reversed. Over the past 2 years, exports have grown more than 4 times.
According to our estimates, re-exports constituted 43 percent of total exports. As can be seen from the chart, exports peaked in mid-2023, and current export figures to Russia most likely show a downward trend. (More details on re-exports: Tvyal Newsletter - 2023-09-11).
Figure 1. Armenia’s Trade Turnover with Russia and Forecast
1.2. What are Armenia’s Main Trade Partners and Where Do Finished Products Go?
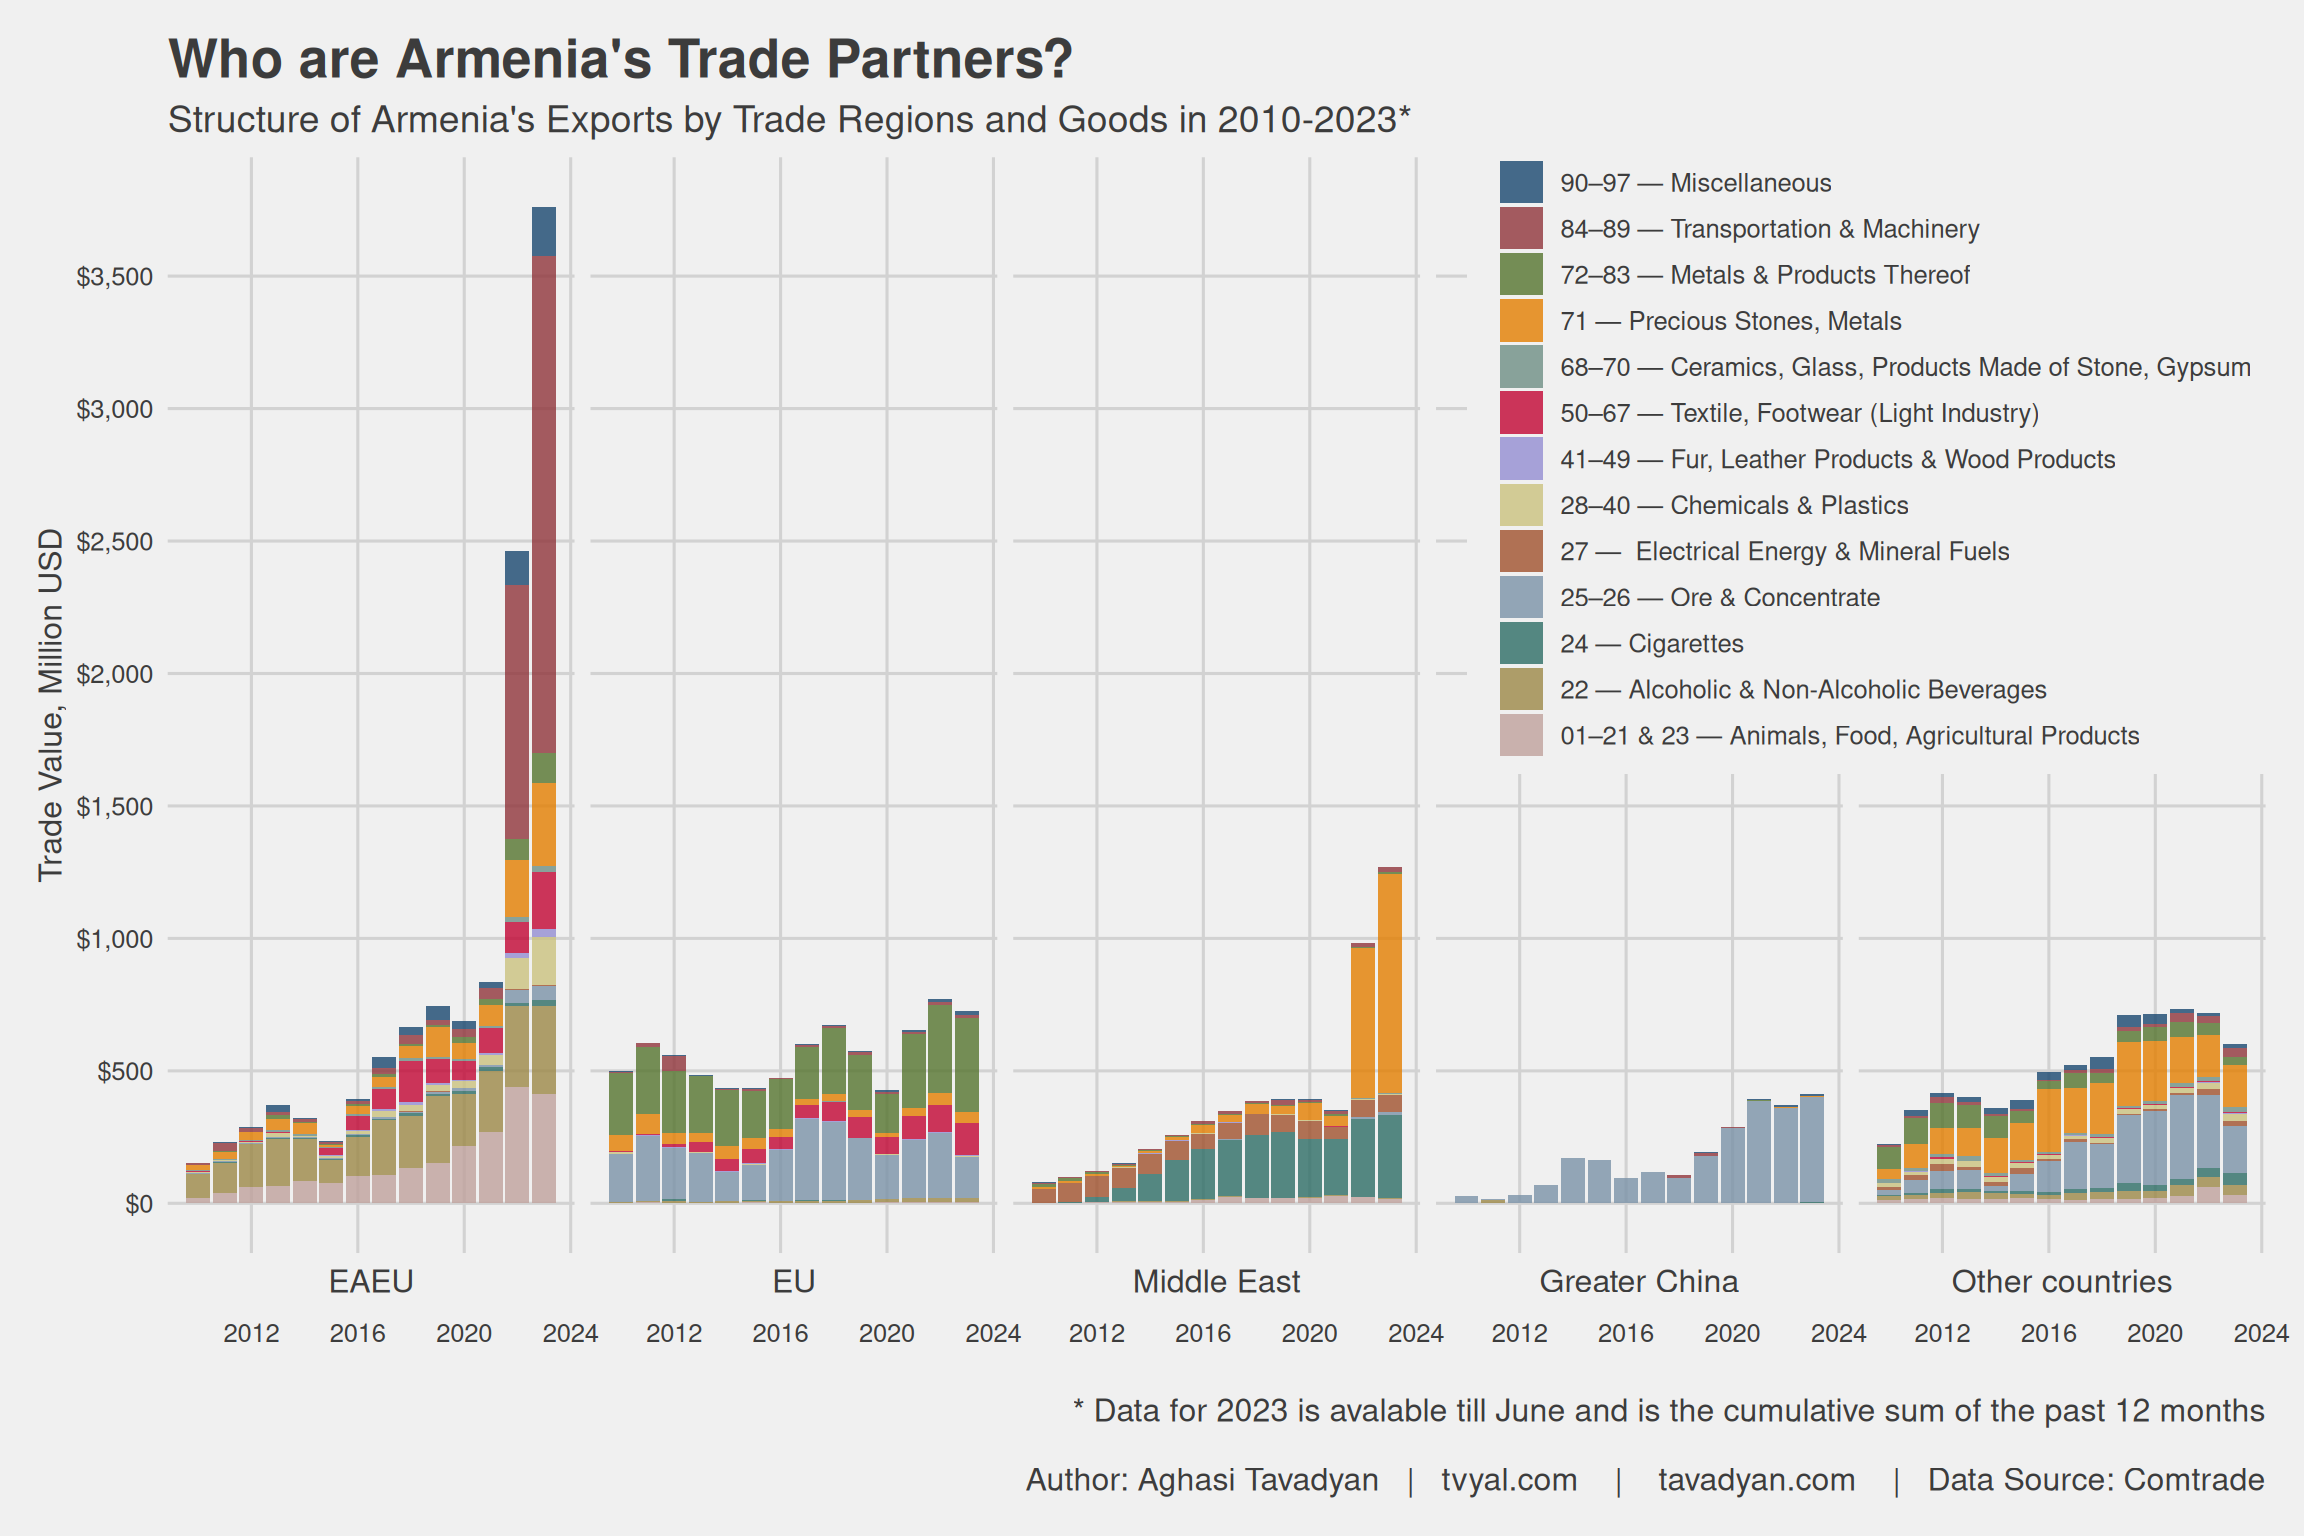
Among the indicators shown in Figure 2, almost all goods from Article 84 of foreign economic activity upwards, destined for the EAEU, are re-exports. Similarly, Article 71 (precious stones and metals) to the Middle East also represents re-exports.
Currently, 55.6 percent of total exports, approximately 3.8 billion USD, go to the EAEU. About 18.8 percent of exports, 1.3 billion USD, go to the Middle East. This means more than half of goods are exported to the EAEU.
To China, the lion’s share is copper ore (Article 25); this direction constitutes 6.1 percent of exports.
Exports to the European Union mainly consist of ore and metals (76 percent), with an exception being the light industry, which has been developing since 2013 and currently accounts for 18 percent of exports to the EU. The EU comprises 10.7 percent of total exports, at 0.73 billion USD.
Exports to the EAEU, mainly Russia, have the most diversified structure; high-value-added final products are exported. Of course, we must exclude re-exports, which currently constitute more than half of exports in that direction (see the higher-numbered articles starting from 84). However, even if we remove these articles from the chart (dark blue and dark red), the growth here is also significant, almost twofold.
It should be noted that the export of vehicles is an important article for Armenia’s economy within re-exports, which also served as a certain stimulus for economic development.
- Calculations for 2023 are made for the 12-month period ending in July.
Figure 2. Structure of Armenia’s Exports by Partner Regions and Product Types (2010-2023)
GDP Relationship in South Caucasus Economies
In the context of current politico-economic developments, there is also a need to study the GDP dynamics of the three South Caucasus states, which allows for a clearer understanding of historical realities.
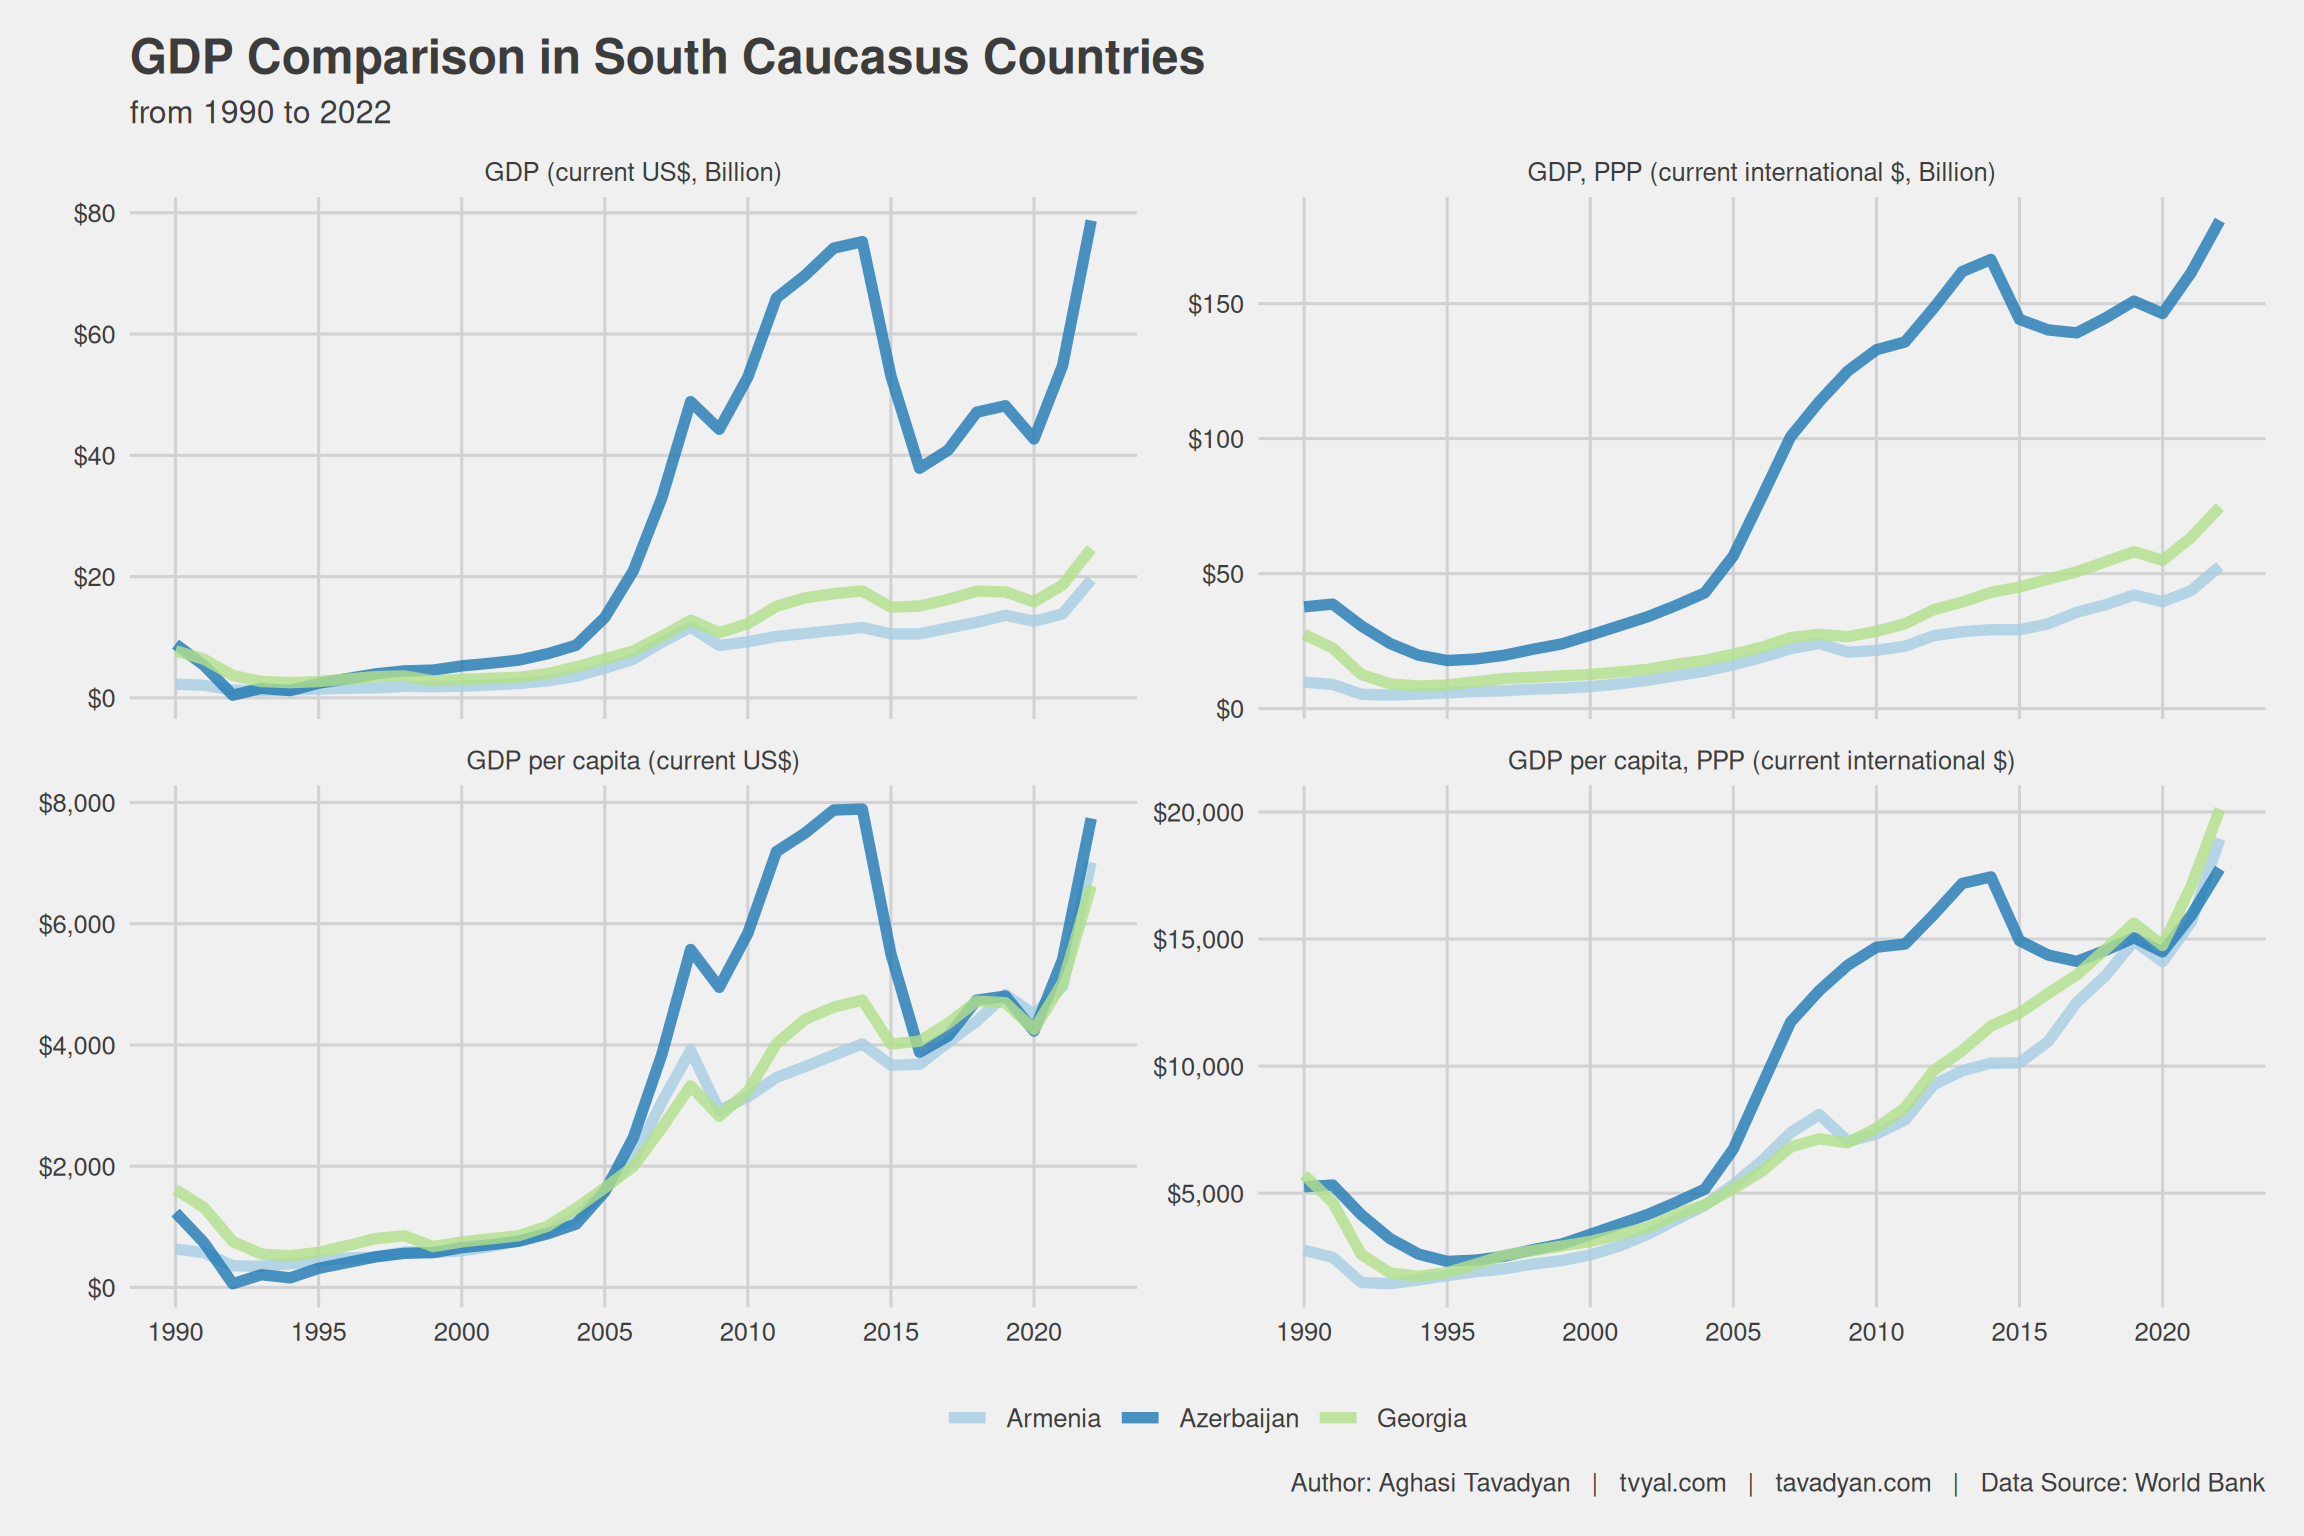
The most important indicator presented in Figure 3 is GDP calculated by purchasing power parity (GDP PPP), which shows how many equivalent goods (including weapons, ammunition) a state can purchase with its money. In 2022, GDP PPP for Armenia was 52.7 billion USD, for Georgia 74.7 billion USD, and for Azerbaijan 180.8 billion USD.
Prior to 2004, the GDP indicators of the South Caucasus states were equivalent. On a per capita basis, the South Caucasus states are comparable. The GDP per capita, calculated by purchasing power parity (GDP per capita, PPP), shows the average individual wealth level in a given state.
Figure 3. GDP Comparison in South Caucasus States
English Summary
The aim of this week’s newsletter is to highlight Armenia’s trade turnover directions. This material aims to shed light on where and what we export, and what potential our ready, high-value-added products have abroad. Statistical data and code for this, as well as other materials published by us, are available; see the GitHub link below.
Armenia’s Trade with Russia: As of September 2023, Armenia exports 24 percent more goods to Russia than it imports. In the 12 months leading up to September 2023, exports reached 3.68 billion USD, while imports were 2.97 billion USD. More than 52 percent of Armenia’s total exports, primarily high-value-added final products, go to Russia. This suggests that Russia’s economy is currently somewhat more dependent on Armenia. In contrast, in 2021, annual exports to Russia were 841 million USD, with imports nearly double at 1.79 billion USD. Over the past two years, exports have grown more than fourfold. Our estimates indicate re-exports constituted 43 percent of total exports. As Figure 1 illustrates, exports peaked in mid-2023, and current export figures to Russia are likely showing a downward trend.
Armenia’s Main Trade Partners and Finished Products: Figure 2 shows that almost all goods from Article 84 of foreign economic activity upwards, destined for the EAEU, are re-exports. Similarly, Article 71 (precious stones and metals) to the Middle East also represents re-exports. Currently, 55.6 percent of total exports, approximately 3.8 billion USD, go to the EAEU, and about 18.8 percent, 1.3 billion USD, go to the Middle East. This means more than half of goods are exported to the EAEU. To China, the lion’s share is copper ore (Article 25), constituting 6.1 percent of exports. Exports to the European Union mainly consist of ore and metals (76 percent), with light industry, developing since 2013, accounting for 18 percent of EU exports. The EU makes up 10.7 percent of total exports, at 0.73 billion USD. Exports to the EAEU, mainly Russia, have the most diversified structure, comprising high-value-added final products. While re-exports currently make up more than half of exports in that direction, even excluding these higher-numbered articles (dark blue and dark red in the chart), the growth remains significant, almost twofold. The export of vehicles, a crucial article within re-exports, has also stimulated Armenia’s economic development. Calculations for 2023 are made for the 12-month period ending in July.
GDP Relationship in South Caucasus Economies: In the context of current politico-economic developments, it is necessary to study the GDP dynamics of the three South Caucasus states to gain a clearer understanding of historical realities. Figure 3 presents the GDP calculated by purchasing power parity (GDP PPP), which indicates the equivalent amount of goods (including weapons and ammunition) a state can purchase with its money. In 2022, GDP PPP for Armenia was 52.7 billion USD, for Georgia 74.7 billion USD, and for Azerbaijan 180.8 billion USD. Prior to 2004, the GDP indicators of the South Caucasus states were equivalent. On a per capita basis, the South Caucasus states are comparable. The GDP per capita, calculated by purchasing power parity (GDP per capita, PPP), shows the average individual wealth level in a given state.