Merry Christmas and Happy New Year
🎄🎅🎁✨🔔🕯️🦌🎉🍪🥛⛄🌨️🧤🧣🍬🍭
Thank you for following our work.
Thanks for your time and for hanging with us.

Let’s summarize the year
- almost half a year: 25 weeks, 25 analyses ⏳
- more than 10 thousand lines of code 💻
- more than 50 plots 📊
- 950 subscribed emails 📬
Let’s summarize the year
- Almost half a year: 25 weeks, 25 analyses ⏳
- More than 10 thousand lines of code 💻
- More than 50 plots 📊
- 950 subscribed emails 📬
Please rate our work
Please rate our work
The survey is short.

There will be no newsletter next week. We will meet next year. Happy holidays.
Media reports
Watch my latest interview with Nver Mnatsakanyan, where I summarize 2023.
The following topics were covered in the interview:
- Why were 242 billion drams more in taxes collected in Armenia in 2023?
- Armenia’s economy grew by 7 percent, with tourism and IT as locomotives.
- Builders are returning to Armenia from Russia; the dram is strengthening against the ruble.

The Christmas Tree code
All analyses sent to you were prepared using code, mainly in R and Markdown programming languages. Office software was not used in conducting the research. All analyses are also available on our website, and the code and data for all analyses are posted on Github.
🎄 Today, for the first time, I decided to share the code with you. In this case, the code for drawing the Christmas tree. 🎄
I wish you to be inspired and inspire in the coming year.
The main colors of the Christmas Three and the main parameter
scale_factor, which desides the hight of the three and
ajast everything acordingly.
# Change to adjust the tree height. Provide an odd number to works properly
scale_factor = 15

# defining the colors
tree_colors = c(
  "#A8D185", "#04905E", "#9acd32", "#3D9618", "#8AD378", "#3FD485",
  "#089E79", "#079094", "#2F9B61", "#50C878", "#008000", "#008000"
)

bauble_colours = c(
  "#646F75", "#949399", "#8C9EAA", "#C3C4C6",
  "#9CC6D4", "#CD936D", "#DB7076", "#E04C52"
)

garland_reds <- c(
  "#ff0000", "#ffa07a", "#fa8072", "#ff6347",
  "#cd5c5c", "#ff4500", "#dc143c", "#b22222"
)

green_shades <-
  tibble(
    x = seq(0, scale_factor, by = 1),
    y = scale_factor/2 + 1,
    fill = colorRampPalette(c("#013220", "darkgreen"))(scale_factor + 1)
  )

set.seed(1234)
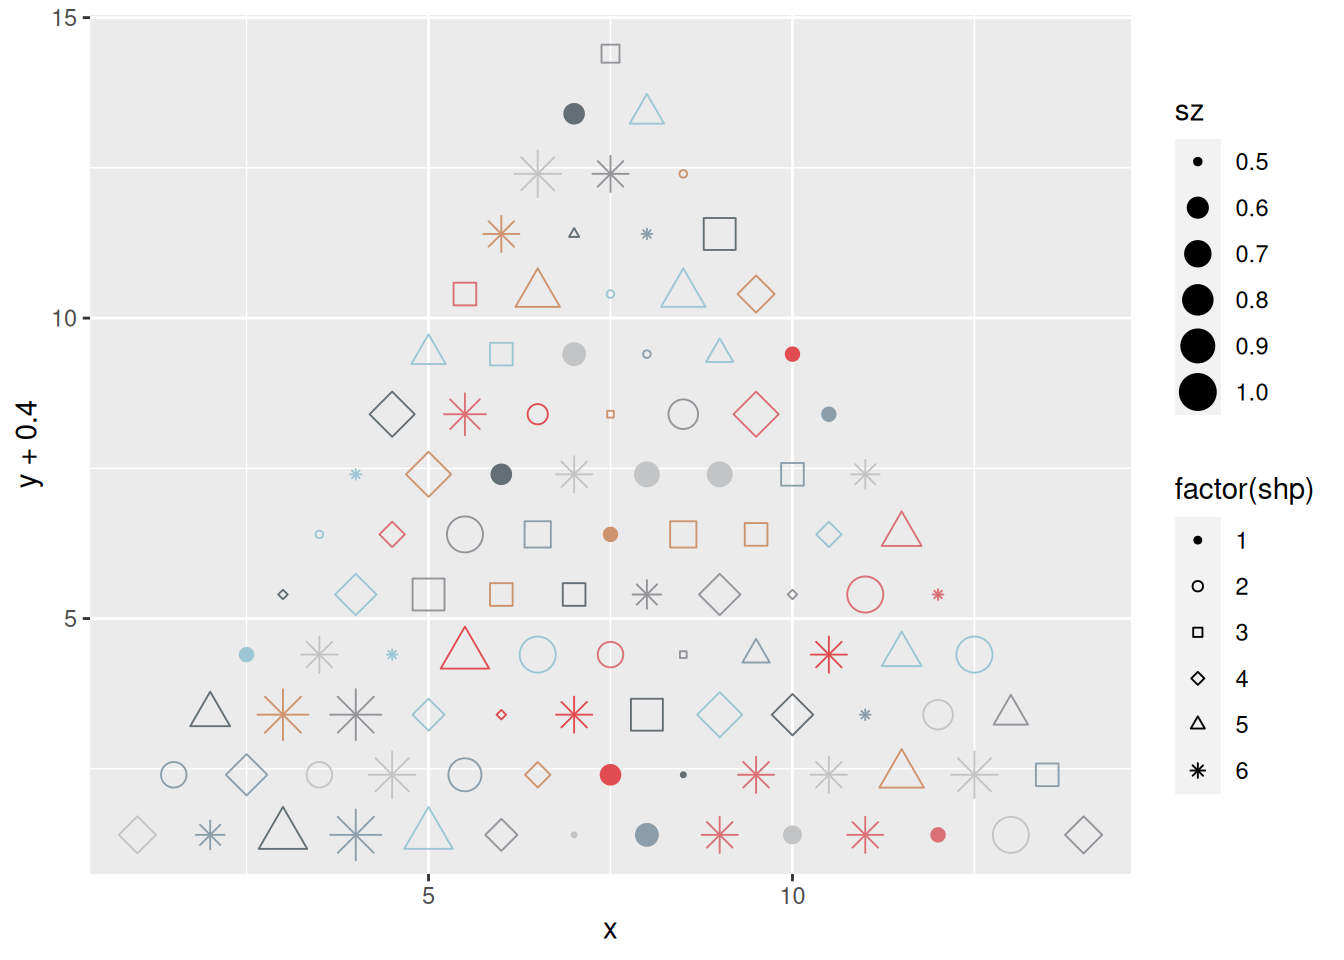
Constructing the Christmas Tree toys (bubbles) database and ploting it.
# Christmas tree bubbles database
bubbles <-
  crossing(
    x = 1:(scale_factor*2),
    y = 1:scale_factor
  ) |>
  filter(
    x %% 2 != y %% 2,
    y <= x,
    y <= -x + max(x)
  ) %>%
  mutate(
    x = x / 2,
    shp = sample(1:6, nrow(.), replace = T),
    sz = sample(seq(0.5, 1, by=0.1), nrow(.), replace = T),
    color = sample(bauble_colours, nrow(.), replace = T),
  )

# Let's see the bubbles in a plot
bubbles |>
  ggplot(aes(x = x, y = y + 0.4, shape = factor(shp), size=sz, color = I(color))) +
  geom_point() +
  scale_shape_manual(values = c(20:24,8))
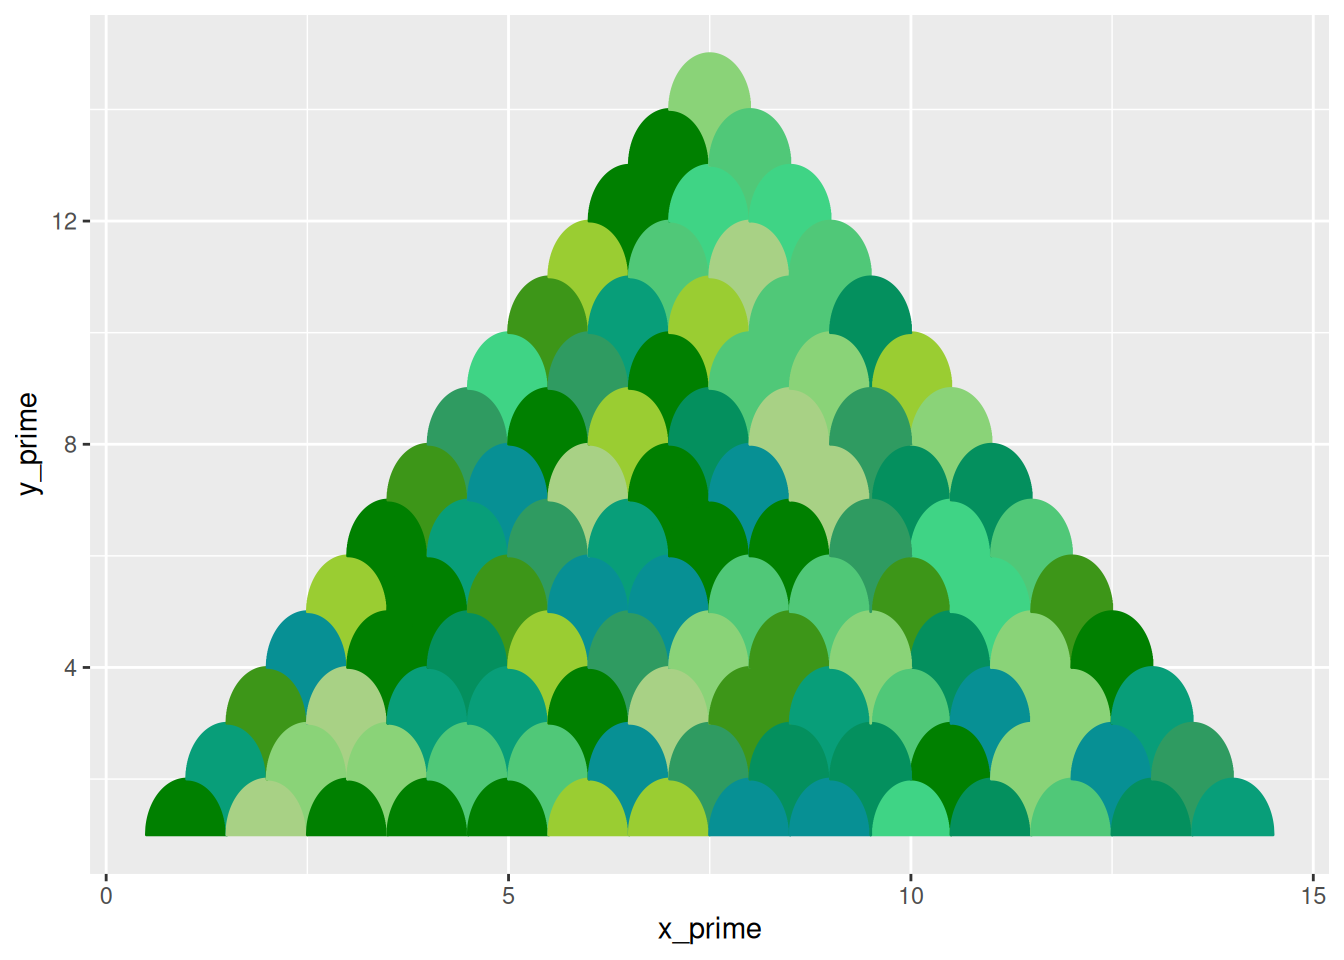
Constructing the three database with geometric scales and the tree
topper. Below is the plot of Christmas three scales. Here the heavy
lifting does the x^2 + y^2 = 1 circle equation:
y_prime = sqrt(1 - x_prime^2).
main_shape_contour <- function(tbl) {
  tbl <-
    tbl |>
    mutate(
      y_prime = sqrt(1 - x_prime^2),
      y_prime2 = ifelse(x_prime >= 0, x_prime - 1, x_prime + 1),
      y_prime2 = sqrt(1 - (y_prime2)^2)-1,
      x_prime = x_prime + x,
      y_prime = y_prime + y,
      y_prime2 = y_prime2 + y,
      x_prime = x_prime / 2,
      x = x / 2,
    ) |>
    pivot_longer(contains("y_prime"), values_to = "y_prime") |>
    filter(y_prime >= 1)

  return(tbl)
}

main_tree <-
  crossing(
    x = 1:(scale_factor*2),
    y = 1:scale_factor,
    x_prime = seq(-1, 1 , 0.01)
  ) |>
  filter(
    x %% 2 != y %% 2,
    y <= x,
    y <= -x + max(x)
  ) %>%
  mutate(
      color = sample(tree_colors, nrow(.), replace = TRUE)
  ) %>%
  main_shape_contour()

treetopper_data <-
  tibble(
    x = scale_factor,
    y = scale_factor + 1,
    x_prime = seq(-1, 1 , 0.01)
  ) |>
  main_shape_contour() |>
  crossing(
    nesting(
      linetype = as.factor(1:7),
      color = sample(garland_reds, 7)
    )
  )

# Let's see the tree in a plot
main_tree |>
  ggplot(aes(x_prime, y_prime, group = paste(x, y))) +
  geom_polygon(aes(fill = I(color), color = I(color)))

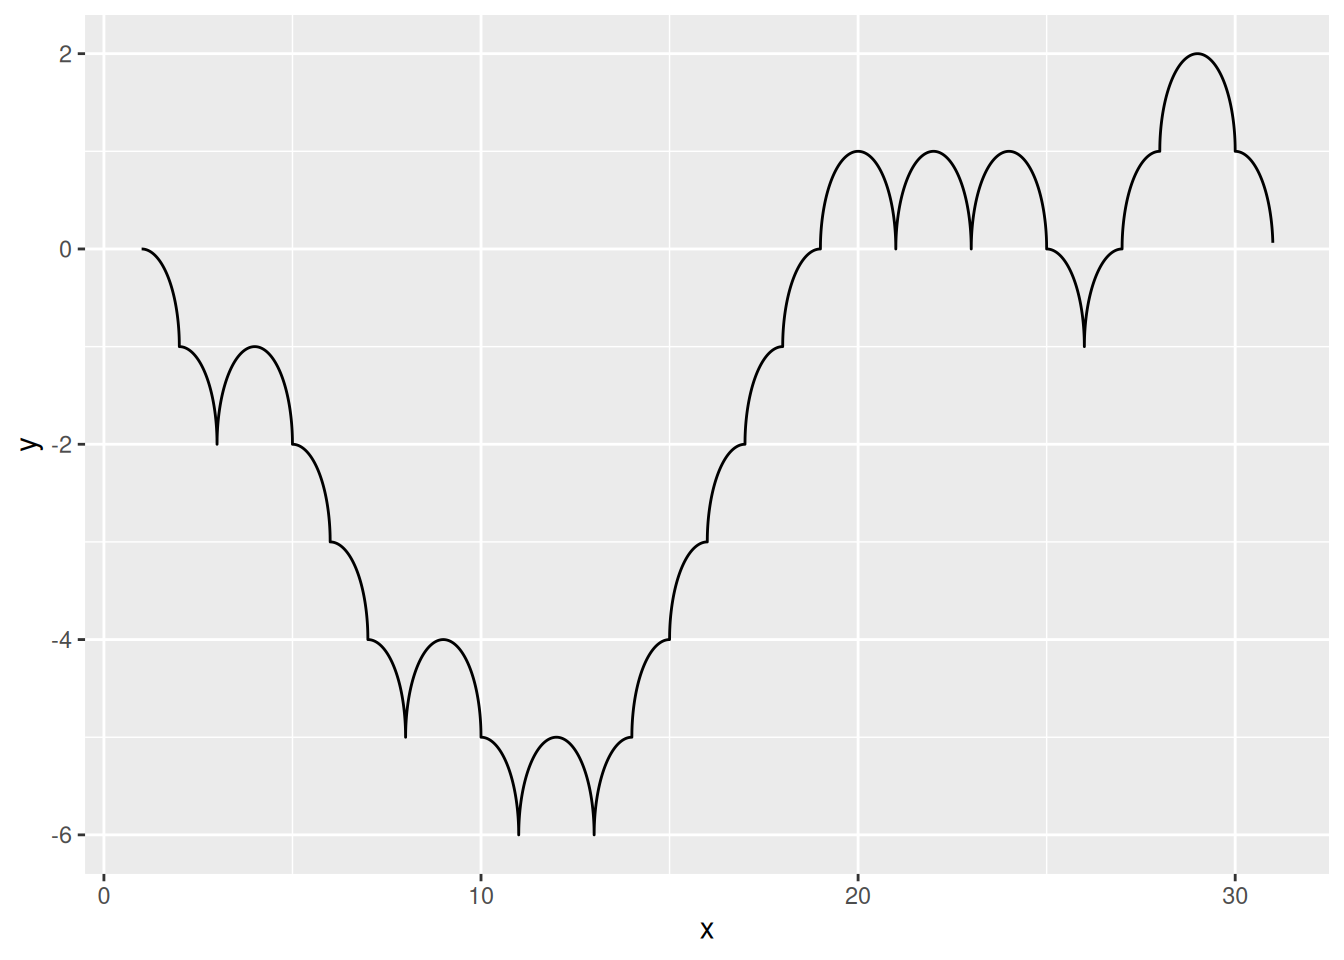
This function was the hardest. It randomly constructs a garland line that mimics the scales of the Tree.
# This function plots a random gerland based on the geometry of the tree
garland <-
  function(len = scale_factor * 2, resalution = 500) {
    j = NULL
    j[1] = 0

    for (i in 1:len) {
      # j[i + 1] = cumsum(j)
      if ((i + sum(j)) %% 2 == 0) {
        j[i + 1] = sample(c(0, 1), size = 1)
      } else{
        j[i + 1] = sample(c(0, -1), size = 1)
      }
    }

    j = tail(j, -1)

    data <-
      tibble(
        x_floor = 1:len,
        y_floor = cumsum(j)
      ) |>
      crossing(x = seq(0, 1 - 1/resalution, 1/resalution)) |>
      mutate(
        x = x_floor + x,
        y = case_when(
          (x_floor + y_floor) %% 2 == 0 ~ sqrt(1 - (x %% x_floor)^2),
          (x_floor + y_floor) %% 2 == 1 ~ sqrt(1 - (x %% x_floor - 1)^2),
        ),
        y = y + y_floor
      ) |>
      select(x,y)

    return(data)
  }

# An exsample of a random garland
garland() |>
  ggplot(aes(x,y)) +
  geom_line()
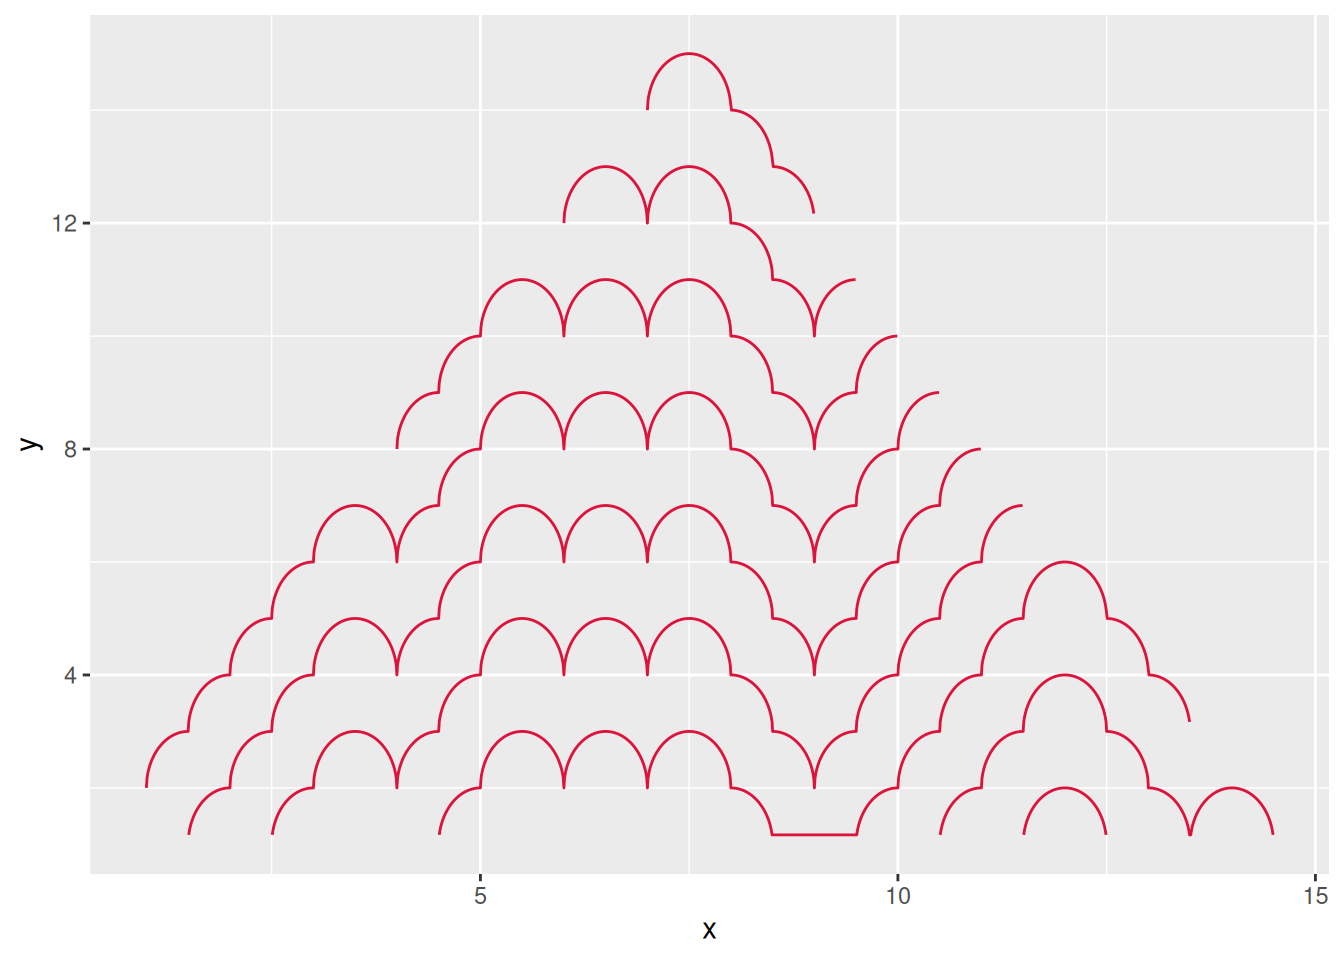
This functin just multiples the said random garland to be drown all over the Three.
garland_multiplayer <-
  function() {

    garland(resalution = 70) |>
      crossing(
        nesting(
          linetype = as.factor(1:7),
          color = sample(garland_reds, 7)
        ),
        nesting(
          hight = seq(-scale_factor, scale_factor * 2, 2),
        )
      ) |>
      arrange(hight) |>
      mutate(
        y = y + hight
      ) |>
      filter(
        y > 1,
        floor(y) <= floor(x),
        floor(y) <= -floor(x) + max(x) - 1
      ) |>
      mutate(x = x /2)
  }

# let's see multiplied garlands
garland_multiplayer() |>
  filter(linetype == "1") |>
  ggplot(aes(x, y, color = I(color), group = hight)) +
  geom_line()
Finialy. Combining everything and animating.
# Combine everything together in a animation

christmas_tree_animation <-
  main_tree |>
  ggplot(aes(x_prime, y_prime, group = paste(x, y))) +
  geom_tile(
    data = green_shades,
    aes(x, y, width = 1, height = scale_factor * 1.266667, fill = I(fill))
  ) +
  geom_tile(aes(x = scale_factor/2, y = 0, width = 2, height = 2), fill = "#b22222") +
  geom_polygon(aes(fill = I(color), color = I(color))) +
  geom_point(
    data = bubbles,
    aes(x = x, y = y + 0.4, shape = factor(shp), size=sz, color = I(color)),
    show.legend = F
  ) +
  geom_line(
    data = garland_multiplayer(),
    aes(
      x, y,
      linetype = as.factor(linetype),
      group = hight, color = I(color)
    ),
    linewidth = 1.8
  ) +
  geom_line(
    data = treetopper_data,
    aes(
      x_prime, y_prime,
      linetype = as.factor(linetype),
      group = paste(x, y), color = I(color)
    ),
    linewidth = 1
  ) +
  labs(
    title = "Merry Christmas & Happy New Year",
    subtitle = NULL,
    caption = "tvyal.com"
  ) +
  scale_shape_manual(values = c(20:24,8)) +
  theme_void() +
  coord_fixed() +
  theme(
    legend.position = "drop",
    plot.background = element_rect(fill="#013220"),
    title = element_text(colour="white"),
    plot.title = element_text(
      size = 30, hjust = 0.5,
      margin = margin(t = 30, unit = "pt")
    ),
    plot.caption = element_text(
      size = 14, hjust = 0.5,
      margin = margin(b = 12, unit = "pt")
    )
  ) +
  transition_states(linetype, transition_length = 2, state_length = 1) +
  enter_fade() +
  exit_fade()
Rendering and saving the animation.
animate(
  christmas_tree_animation,
  nframes = 26,
  width = 600,
  height = 806
)

gganimate::anim_save("christmas_tree_animation.gif")
The end result: