Households Grew Poorer in 2022
In 2022, economic growth of 12.6 percent was recorded, and GDP per capita increased from $4,972 to $7,018, a 41 percent rise; however, the real incomes of the population fell.
In 2021, the average adjusted household income was 333 thousand drams, while in 2022, it was 320 thousand drams. The threshold for the poorest 10% of the population received up to 101 thousand drams in 2021, and by 2022, it was already 88 thousand drams.
In the first chart, the rows represent the regions, and the columns represent the social strata (vulnerable, middle class, and wealthy). If the line is red, incomes decreased compared to the previous year; if blue, they increased.
Chart 1. Change in Gross Household Incomes by Region
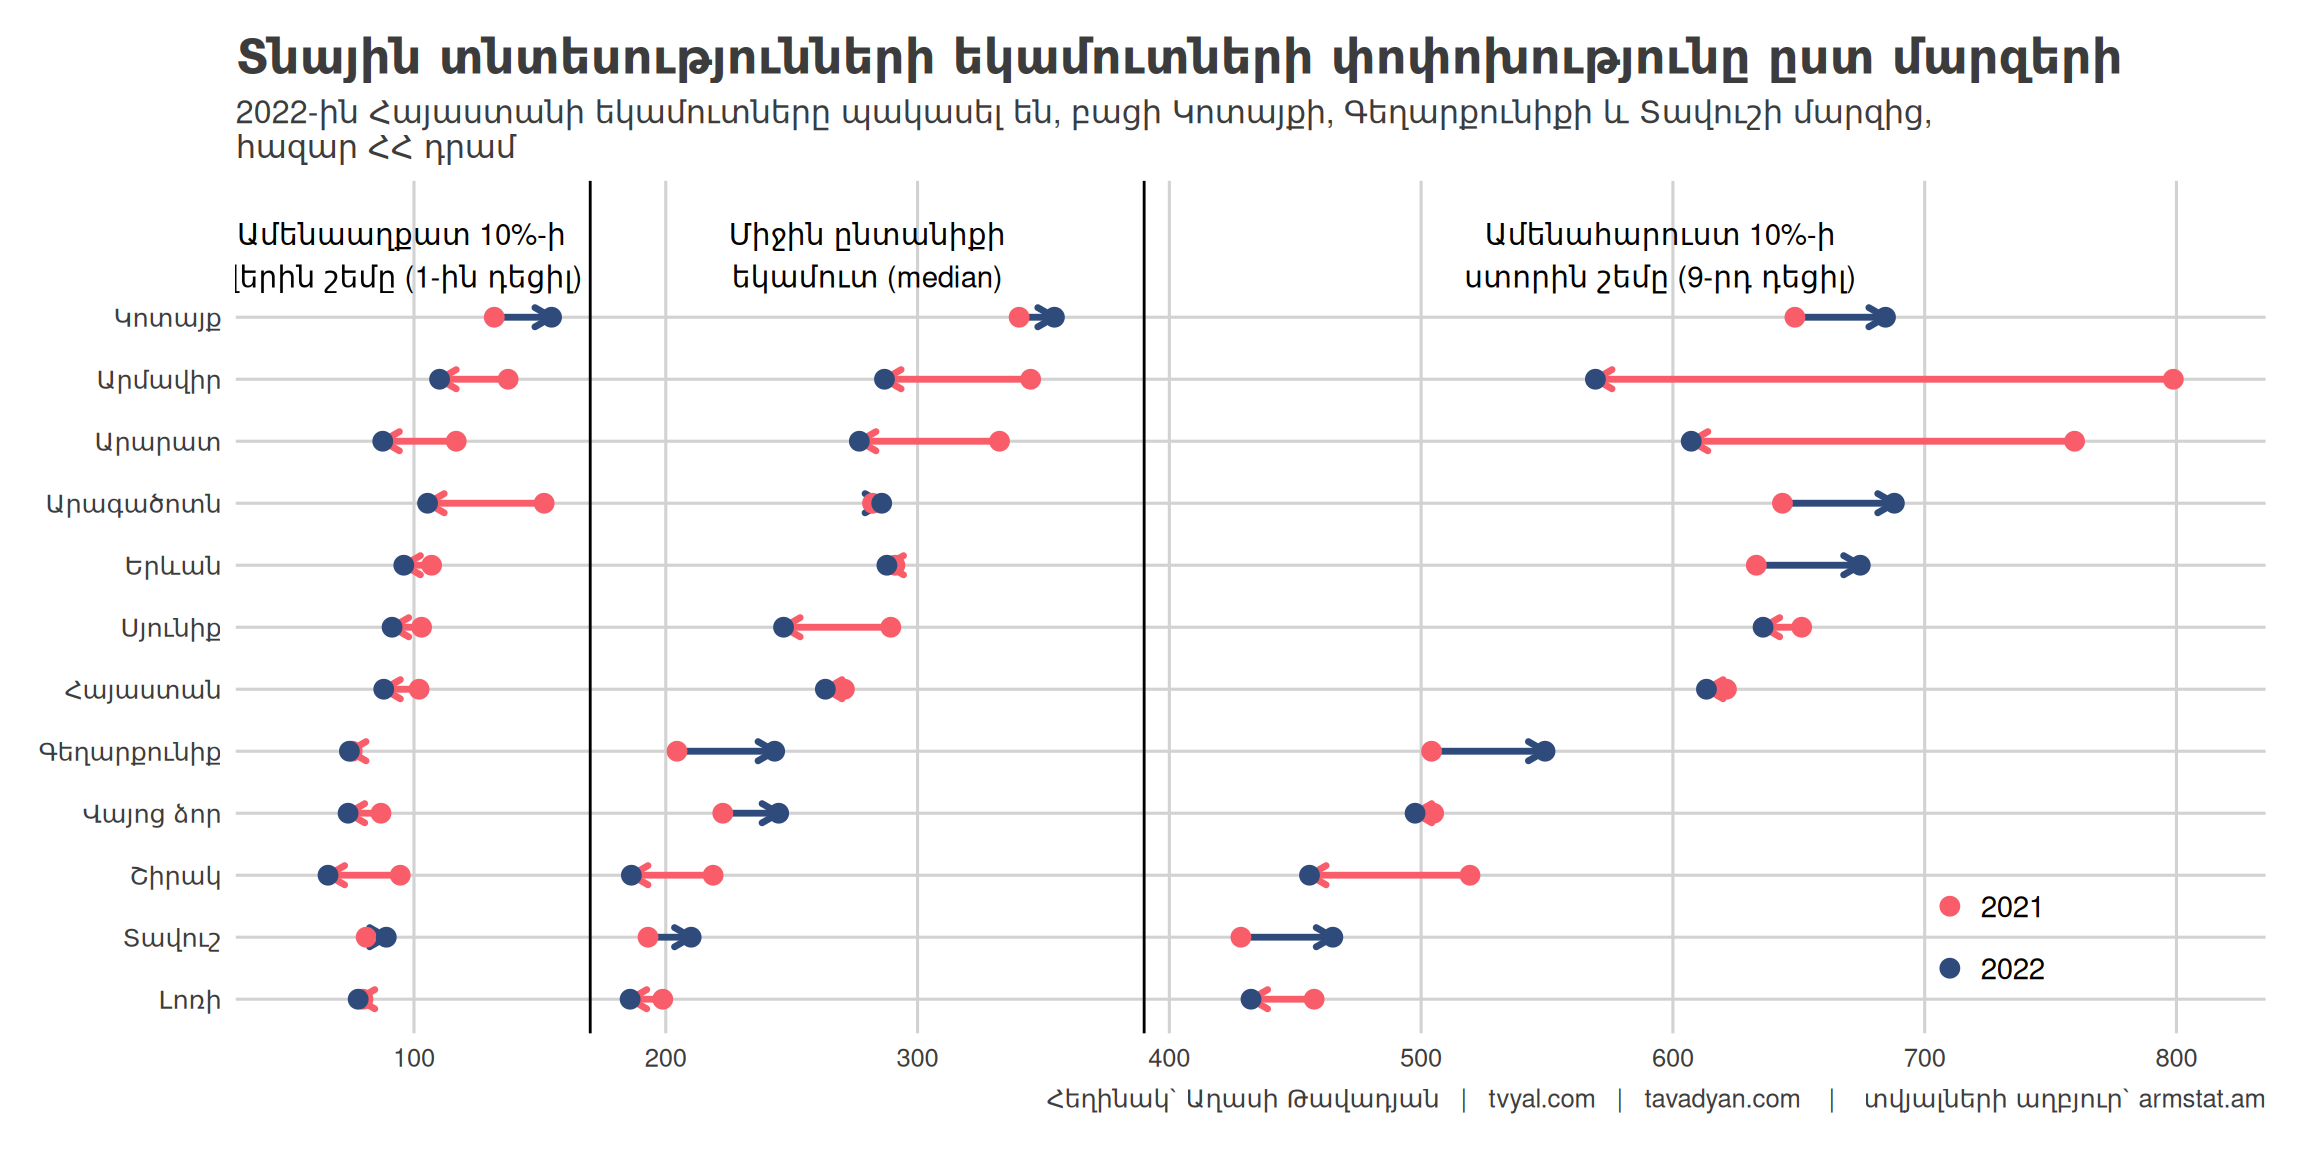
Household incomes decreased in 2022 in all regions except Kotayk, Gegharkunik, and Tavush provinces.
In Yerevan and Aragatsotn, the wealthy became richer in 2022, while the poor became poorer.
In the remaining regions, as well as for all of Armenia, incomes for all strata decreased compared to 2021.
Let’s examine the change in household incomes starting from 2018. As can be seen, inflation-adjusted incomes for Armenia were at their highest point in 2020, with the average statistical family receiving 278 thousand drams per month (at year-end 2022 prices). Over two years, the average family’s income fell by 15 thousand drams, to 263 thousand drams. In Yerevan, the average family’s income did not change during these two years; it primarily decreased in the regions. During the mentioned two years, representatives of Yerevan’s wealthy stratum (9th decile) recorded an increase in income, with their real family income threshold rising from 629 thousand in 2022 to 671 thousand drams.
Chart 2. Change in Armenian Household Incomes from 2018 to 2022

The next chart compares inflation-adjusted annual household incomes starting from 2005. Incomes have been divided into ascending baskets.
Chart 3. What is the Monthly Income of Armenian Families?

As can be seen from the chart, the number of those receiving up to 128 thousand drams increased by 3.5 percentage points compared to 2021. The number of those receiving 128-256 thousand drams decreased by 1.9 percentage points.
Data is available from 2005. The chart also shows that inflation-adjusted household incomes have recorded stable growth since 2005. According to the data, real household incomes registered the largest growth in 2006 and 2007, as well as in 2019.
Nominal income growth was also recorded in 2021 and 2022; however, during those years, inflation of 7.2 and 8.6 percent, respectively, was recorded, which significantly reduced real incomes. This means that by the end of 2022, wages had not yet caught up with the rate of inflation, and the 12.6 percent economic growth recorded in 2022 had not yet impacted household incomes or wage growth. I should note that by the end of 2023, almost zero inflation was recorded. The perspective on zero inflation is presented in the video.
The idea presented in the third chart is also alternatively reflected in the next chart.
Chart 4. What is the Monthly Income of Armenian Families, an Alternative View

Let’s also present the change in household incomes over the years in a table format.
Change in Armenian Household Incomes in Thousand Dram, Incomes Adjusted to Year-End 2022 Prices and Weighted
| Տարի | Ամենաաղքատ 10%-ի վերին շեմը (1-ին դեցիլ) | Միջին ընտանիքի եկամուտ (median) | Միջին եկամուտ (mean) | Ամենահարուստ 10%-ի ստորին շեմը (9-րդ դեցիլ) |
|---|---|---|---|---|
| 2005 | 43 | 130 | 157 | 292 |
| 2006 | 46 | 149 | 181 | 327 |
| 2007 | 51 | 175 | 209 | 389 |
| 2008 | 62 | 180 | 227 | 425 |
| 2009 | 69 | 203 | 236 | 447 |
| 2010 | 70 | 202 | 240 | 471 |
| 2011 | 74 | 202 | 241 | 450 |
| 2012 | 74 | 223 | 263 | 485 |
| 2013 | 71 | 211 | 250 | 472 |
| 2014 | 70 | 226 | 284 | 555 |
| 2015 | 72 | 225 | 283 | 548 |
| 2016 | 76 | 226 | 330 | 696 |
| 2017 | 79 | 250 | 311 | 585 |
| 2018 | 95 | 274 | 322 | 567 |
| 2019 | 103 | 316 | 365 | 642 |
| 2020 | 107 | 286 | 354 | 631 |
| 2021 | 107 | 291 | 344 | 633 |
| 2022 | 96 | 288 | 354 | 674 |
The data is taken from official sources, specifically, the anonymized microdata base of the Integrated Survey of Living Standards (Living Conditions) of Households (by households) and Armenia’s monthly Consumer Price Index. Household living standard indicators have been adjusted by monthly cumulative inflation, meaning each indicator represents year-end 2022.
Media Announcements
Watch my New Year’s interview with my dear colleague Sos Khachikyan and me, where we summarized the year and discussed what awaits us in 2024.

Full Translation of Armenian Content
In 2022, economic growth of 12.6 percent was recorded, and GDP per capita increased from $4,972 to $7,018, a 41 percent rise; however, the real incomes of the population fell.
In 2021, the average adjusted household income was 333 thousand drams, while in 2022, it was 320 thousand drams. The threshold for the poorest 10% of the population received up to 101 thousand drams in 2021, and by 2022, it was already 88 thousand drams.
In the first chart, the rows represent the regions, and the columns represent the social strata (vulnerable, middle class, and wealthy). If the line is red, incomes decreased compared to the previous year; if blue, they increased.
Chart 1. Change in Gross Household Incomes by Region
Household incomes decreased in 2022 in all regions except Kotayk, Gegharkunik, and Tavush provinces.
In Yerevan and Aragatsotn, the wealthy became richer in 2022, while the poor became poorer.
In the remaining regions, as well as for all of Armenia, incomes for all strata decreased compared to 2021.
Let’s examine the change in household incomes starting from 2018. As can be seen, inflation-adjusted incomes for Armenia were at their highest point in 2020, with the average statistical family receiving 278 thousand drams per month (at year-end 2022 prices). Over two years, the average family’s income fell by 15 thousand drams, to 263 thousand drams. In Yerevan, the average family’s income did not change during these two years; it primarily decreased in the regions. During the mentioned two years, representatives of Yerevan’s wealthy stratum (9th decile) recorded an increase in income, with their real family income threshold rising from 629 thousand in 2022 to 671 thousand drams.
Chart 2. Change in Armenian Household Incomes from 2018 to 2022
The next chart compares inflation-adjusted annual household incomes starting from 2005. Incomes have been divided into ascending baskets.
Chart 3. What is the Monthly Income of Armenian Families?
As can be seen from the chart, the number of those receiving up to 128 thousand drams increased by 3.5 percentage points compared to 2021. The number of those receiving 128-256 thousand drams decreased by 1.9 percentage points.
Data is available from 2005. The chart also shows that inflation-adjusted household incomes have recorded stable growth since 2005. According to the data, real household incomes registered the largest growth in 2006 and 2007, as well as in 2019.
Nominal income growth was also recorded in 2021 and 2022; however, during those years, inflation of 7.2 and 8.6 percent, respectively, was recorded, which significantly reduced real incomes. This means that by the end of 2022, wages had not yet caught up with the rate of inflation, and the 12.6 percent economic growth recorded in 2022 had not yet impacted household incomes or wage growth. I should note that by the end of 2023, almost zero inflation was recorded. The perspective on zero inflation is presented in the video.
The idea presented in the third chart is also alternatively reflected in the next chart.
Chart 4. What is the Monthly Income of Armenian Families, an Alternative View
Let’s also present the change in household incomes over the years in a table format.
Change in Armenian Household Incomes in Thousand Dram, Incomes Adjusted to Year-End 2022 Prices and Weighted
| Տարի | Ամենաաղքատ 10%-ի վերին շեմը (1-ին դեցիլ) | Միջին ընտանիքի եկամուտ (median) | Միջին եկամուտ (mean) | Ամենահարուստ 10%-ի ստորին շեմը (9-րդ դեցիլ) |
|---|---|---|---|---|
| 2005 | 43 | 130 | 157 | 292 |
| 2006 | 46 | 149 | 181 | 327 |
| 2007 | 51 | 175 | 209 | 389 |
| 2008 | 62 | 180 | 227 | 425 |
| 2009 | 69 | 203 | 236 | 447 |
| 2010 | 70 | 202 | 240 | 471 |
| 2011 | 74 | 202 | 241 | 450 |
| 2012 | 74 | 223 | 263 | 485 |
| 2013 | 71 | 211 | 250 | 472 |
| 2014 | 70 | 226 | 284 | 555 |
| 2015 | 72 | 225 | 283 | 548 |
| 2016 | 76 | 226 | 330 | 696 |
| 2017 | 79 | 250 | 311 | 585 |
| 2018 | 95 | 274 | 322 | 567 |
| 2019 | 103 | 316 | 365 | 642 |
| 2020 | 107 | 286 | 354 | 631 |
| 2021 | 107 | 291 | 344 | 633 |
| 2022 | 96 | 288 | 354 | 674 |
The data is taken from official sources, specifically, the anonymized microdata base of the Integrated Survey of Living Standards (Living Conditions) of Households (by households) and Armenia’s monthly Consumer Price Index. Household living standard indicators have been adjusted by monthly cumulative inflation, meaning each indicator represents year-end 2022.
Watch my New Year’s interview with my dear colleague Sos Khachikyan and me, where we summarized the year and discussed what awaits us in 2024.