
Strong Family: Wealthy Family
Study of Armenian Families
An incomplete family is considered a family consisting of one parent and a child.
Incomplete families are characterized by the following features:
- orphaned,
- parentless,
- divorced.
Let’s examine household incomes by decile group and the age-sex composition within those groups.
Families with a monthly income not exceeding 123 thousand drams fall into the 1st-2nd decile groups. This group is characterized by a large proportion of elderly individuals, with over 35 percent of their families consisting of retirees aged 63 and above. The average size of families in this group is 2 people. These families are mostly incomplete; only one-third in this group has a spouse. The lowest proportion of children is observed in this group, along with a lower share of working-age individuals.
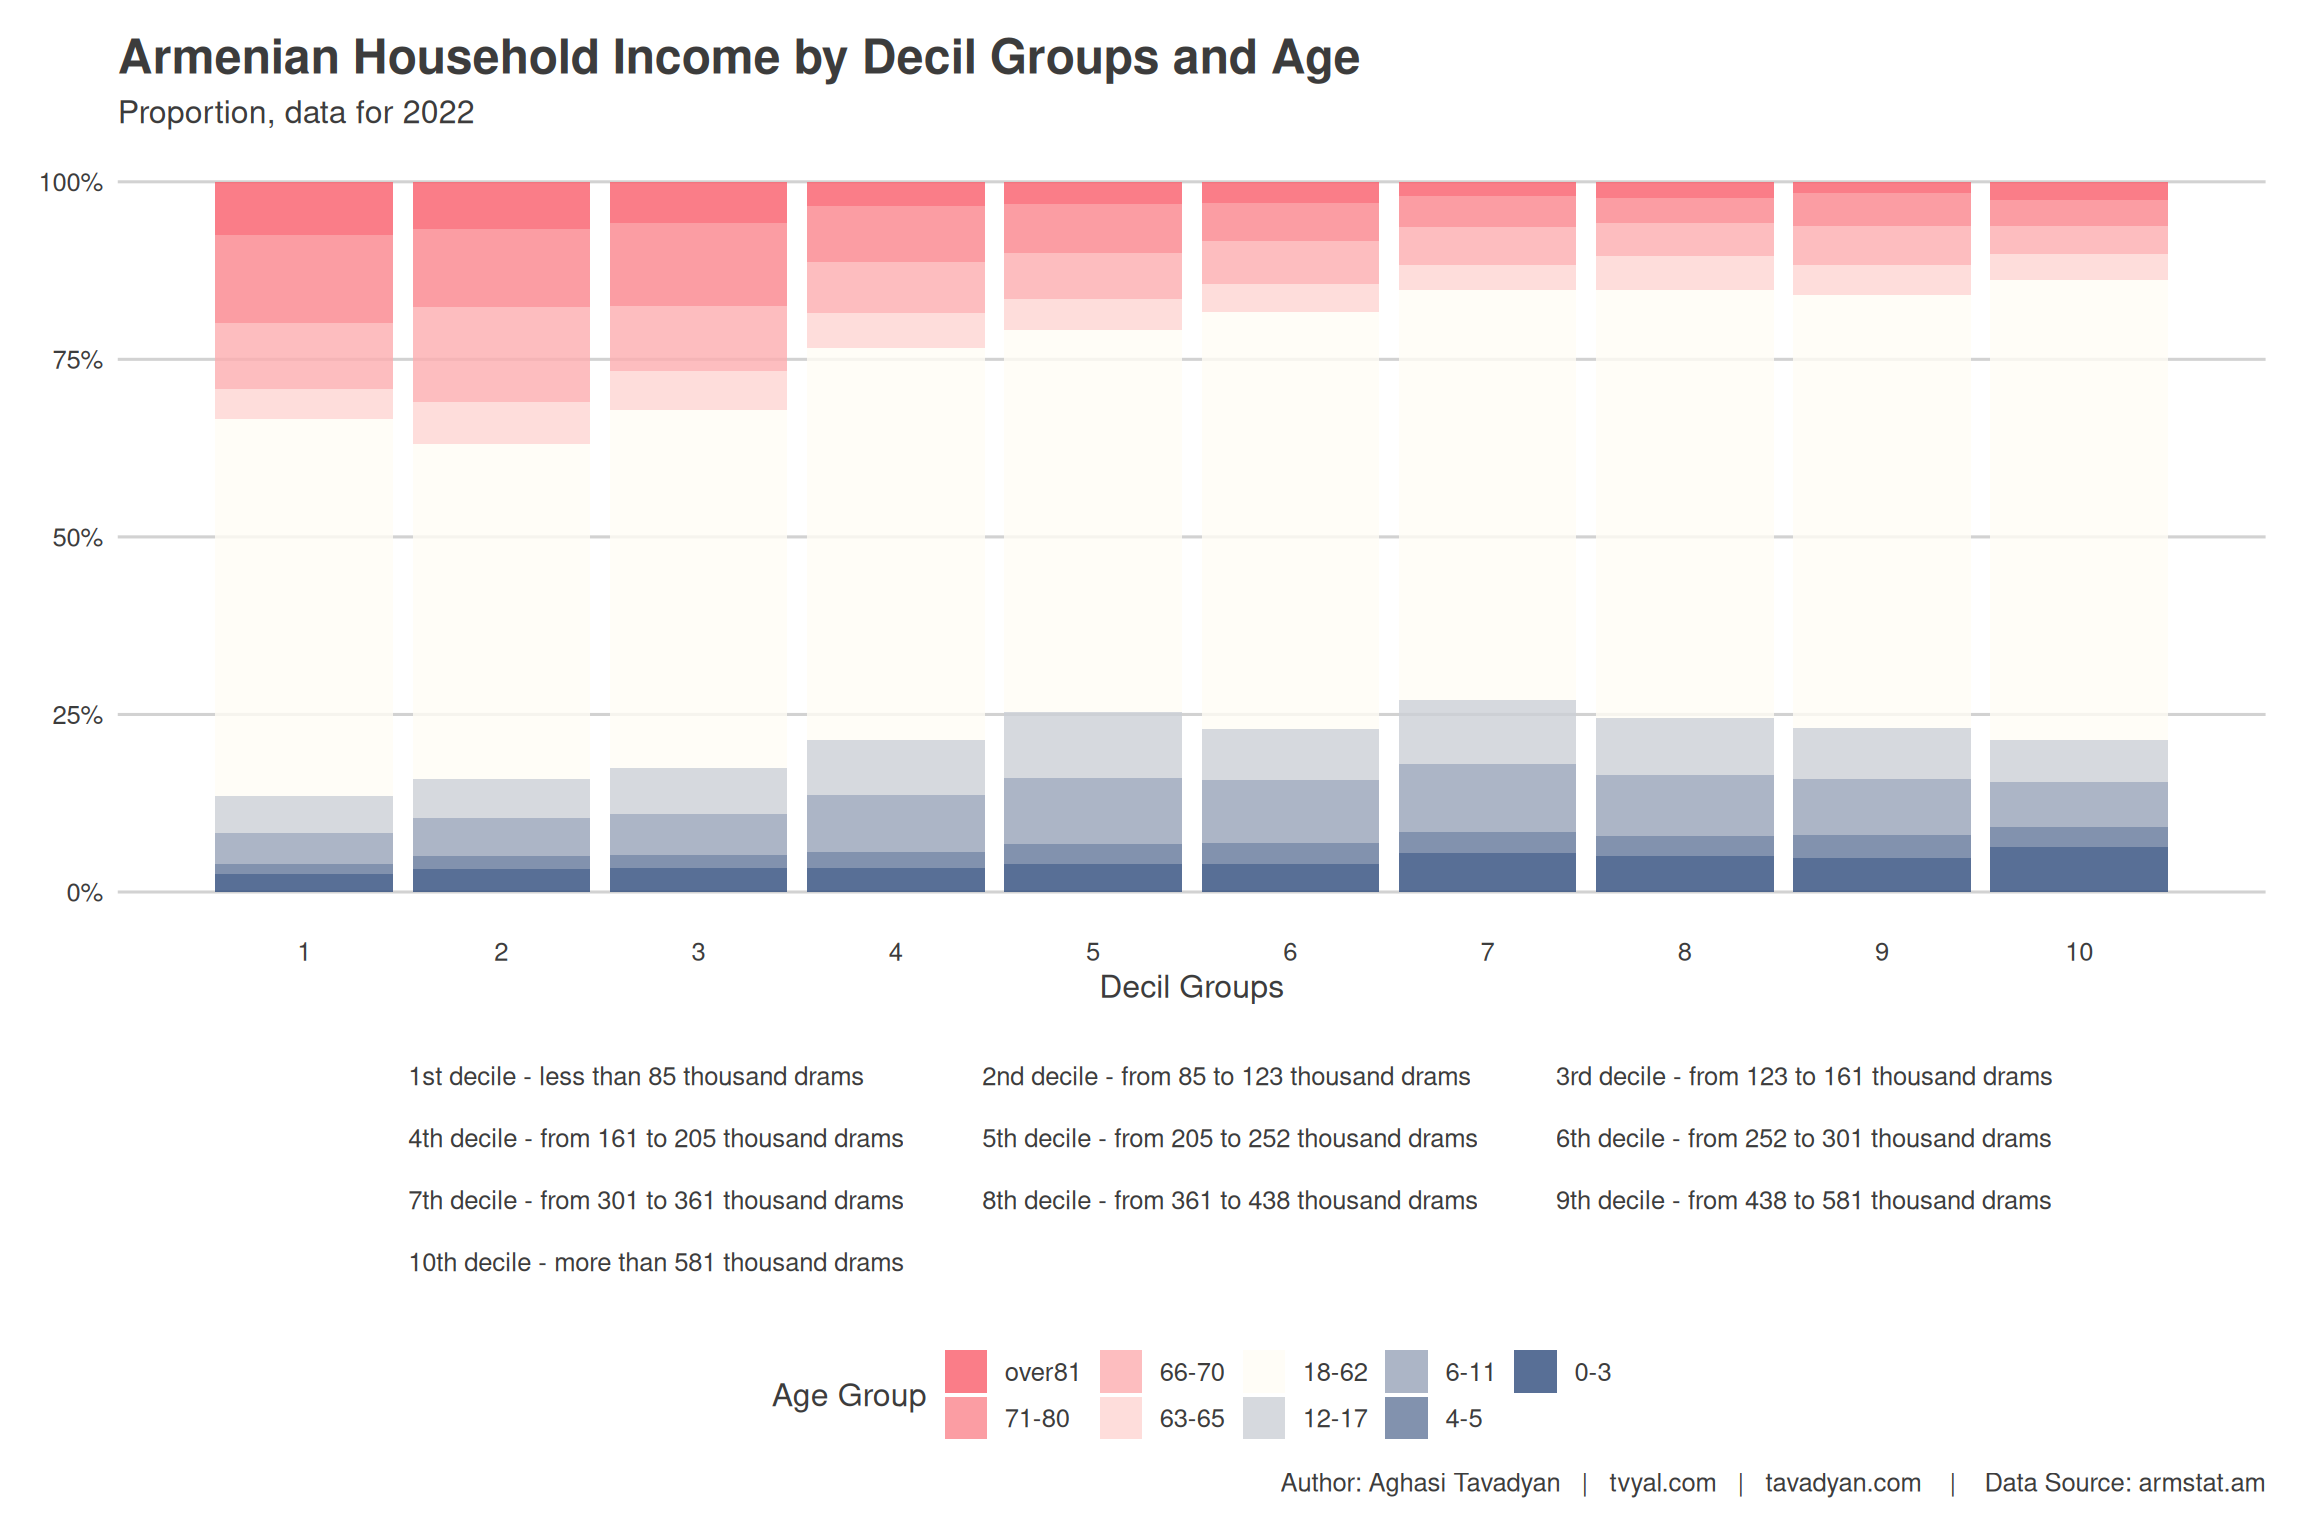
Plot 1. Distribution of Households and Age Groups
Decile groups divide a database into ten equal parts,
each representing 10% of the total observations, in equal proportions.
The first decile represents the first 10% of the data, the second represents
the second 10%, and so on, with the 10th decile representing the highest 10% of the data.
As seen in the plot, the less income a household receives, the greater the likelihood that the number of elderly individuals in that household will be higher. For instance, in households earning less than 123 thousand drams, one-third are citizens aged 63 and above. Consequently, healthcare expenses are higher for this group.
The older the head of the household and the greater the probability that the head of the household is female, the higher the likelihood of the family falling into the disadvantaged stratum. Vulnerable households primarily consist of elderly women who do not have relatives, about 40 percent of whom have a basic education.
The affluent class is distinguished by larger families, as evidenced by the average family size of 5 people in the 10th decile group. Secure households also have a large number of working members, with more than three members being of working age. Furthermore, over 77 percent of the heads of secure families have a spouse. Thus, the presence of a complete family primarily characterizes an affluent family. The level of education is highest in the 10th decile, with 56.3 percent having a basic education.
The middle class is the foundation of society. This class has the highest number of children. Approximately 25 percent of the members of these families are children, in contrast to the affluent class, which has relatively fewer children. In the most secure 10th decile group, the percentage of children is 21 percent.
The presence of a complete family significantly influences the formation of the secure and middle classes, whereas loneliness is predominantly characteristic of the lower class.
Table 1. Demographic Analysis of RA Households
| Armenia’s Household Demographics | |||||||||||
| Summary of demographic and income information in 2022 | |||||||||||
| Household Decile | Average Monthly Income (in thousand AMD) | Demographic Information | Household Composition (Average) | Head of Household (HH) Details | |||||||
| Working-Age Population (%) | Senior Population (over 63, %) | Child Population (0-17, %) | Household Size | Working-Age | Children | Average Age of HH | Proportion of Female in HH (%) | HH with Basic Education (%) | Married HH (%) | ||
| 1 | 65.9 | 52.9% | 33.6% | 13.5% | 1.86 | 0.98 | 0.25 | 65 | 68.6% | 40.6% | 23.8% |
| 2 | 105.0 | 46.9% | 37.5% | 15.6% | 2.24 | 1.05 | 0.35 | 66 | 53.1% | 40.5% | 39.8% |
| 3 | 143.1 | 50.5% | 31.0% | 18.5% | 2.72 | 1.37 | 0.50 | 64 | 43.4% | 40.2% | 52.4% |
| 4 | 186.0 | 55.2% | 23.2% | 21.6% | 3.17 | 1.75 | 0.68 | 62 | 37.2% | 42.4% | 57.4% |
| 5 | 231.3 | 54.4% | 20.2% | 25.4% | 3.62 | 1.97 | 0.92 | 61 | 35.0% | 43.1% | 60.3% |
| 6 | 277.4 | 59.0% | 18.2% | 22.8% | 3.78 | 2.23 | 0.86 | 59 | 25.8% | 47.5% | 70.8% |
| 7 | 336.5 | 58.0% | 15.3% | 26.7% | 4.16 | 2.42 | 1.11 | 58 | 26.5% | 46.2% | 68.8% |
| 8 | 409.8 | 59.9% | 15.2% | 24.9% | 4.47 | 2.68 | 1.11 | 59 | 25.2% | 47.8% | 71.3% |
| 9 | 517.6 | 61.2% | 15.8% | 23.0% | 4.81 | 2.95 | 1.10 | 60 | 18.7% | 49.2% | 77.3% |
| 10 | 722.6 | 65.0% | 13.9% | 21.2% | 5.00 | 3.25 | 1.06 | 59 | 18.3% | 56.3% | 77.5% |
| — | — | — | — | — | — | — | — | — | — | — | — |
Note that this analysis is the second part of the household analysis.
Read the first analysis here:
🏠💰 📉 Households have become poorer.
As can be seen, the main monetary income for the first, second, and third decile groups, receiving a total income of up to 161 thousand drams, comes from pensions.*
The main source of income for the poorest 10 percent of households is pensions, which account for 67 percent of the income for households receiving up to 85 thousand drams; 12 percent comes from family benefits, and wages account for only 7 percent. It should be noted that in this group, the average income from pensions per household is 28 thousand drams. This does not mean that retirees in this group receive an average of 28 thousand drams. It simply means that some households in this group do not have retirees over 63 and thus do not receive pensions. The same applies to the average income from wages. According to the household database, in 2022, the average pension for retirees over 63 was 46,245 drams.
Plot 2. Income Sources of Decile Groups, Drams
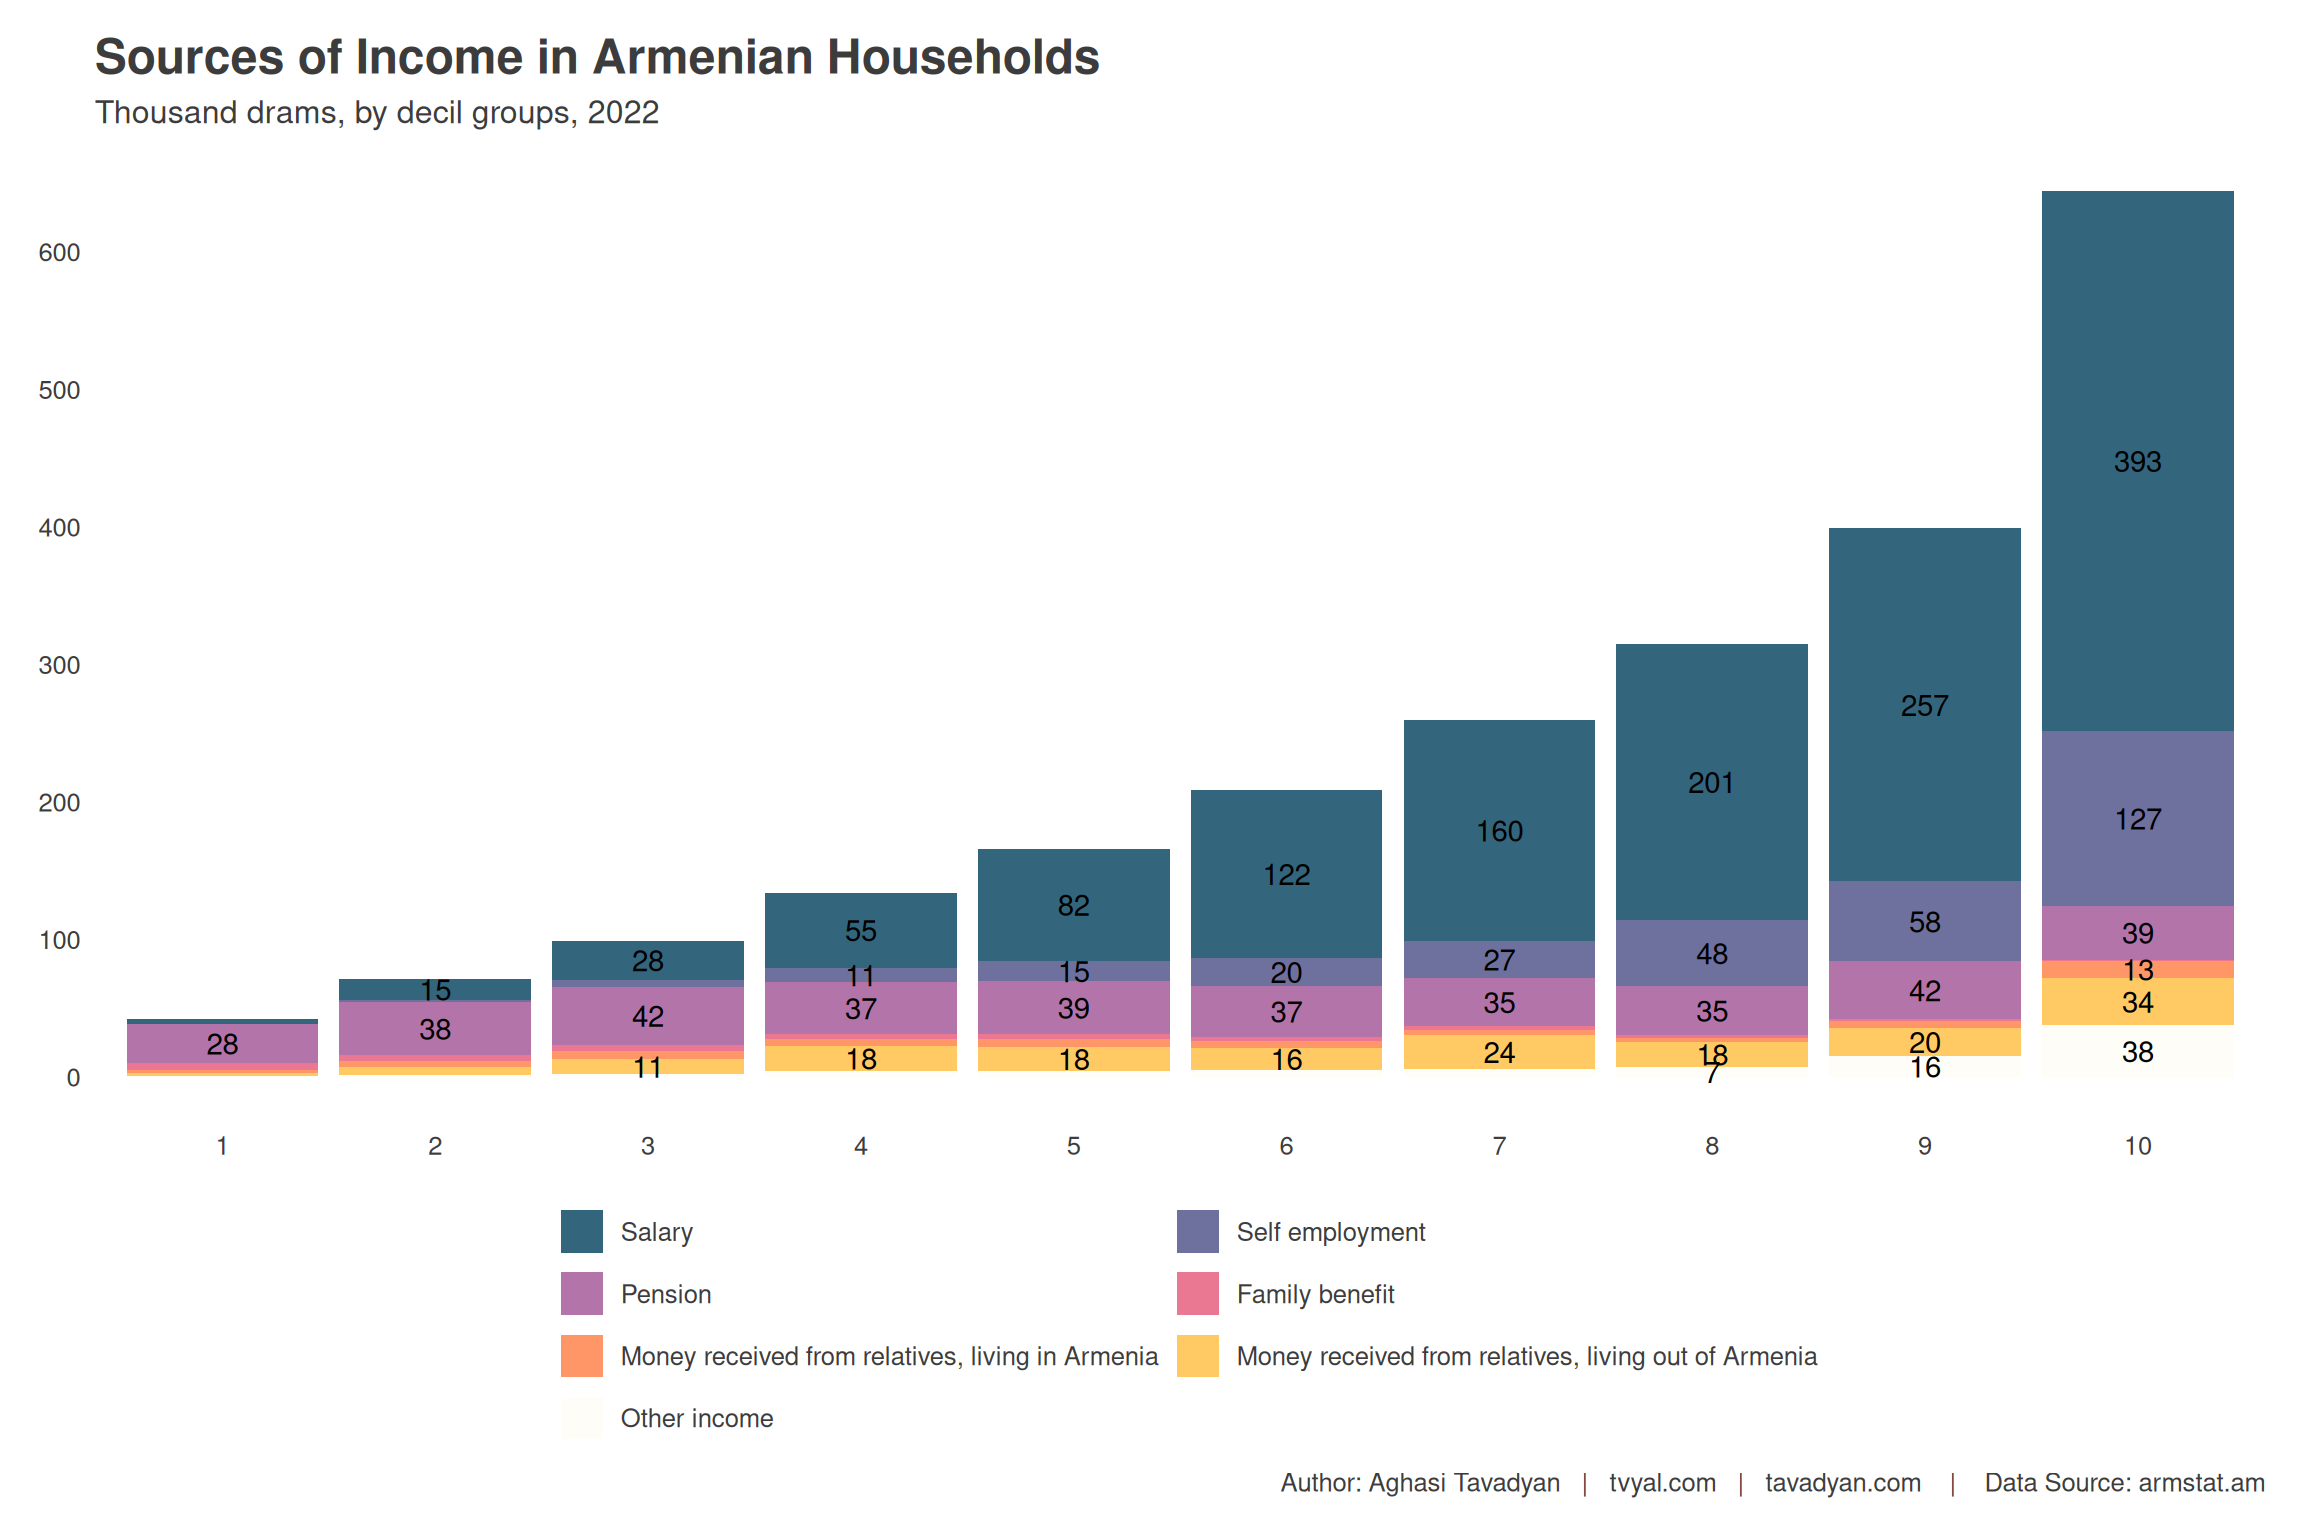
More than 10 percent of the monetary income for the 3rd to 5th decile groups comes from relatives living abroad. This is the largest specific weight. This income is received from migrant workers.
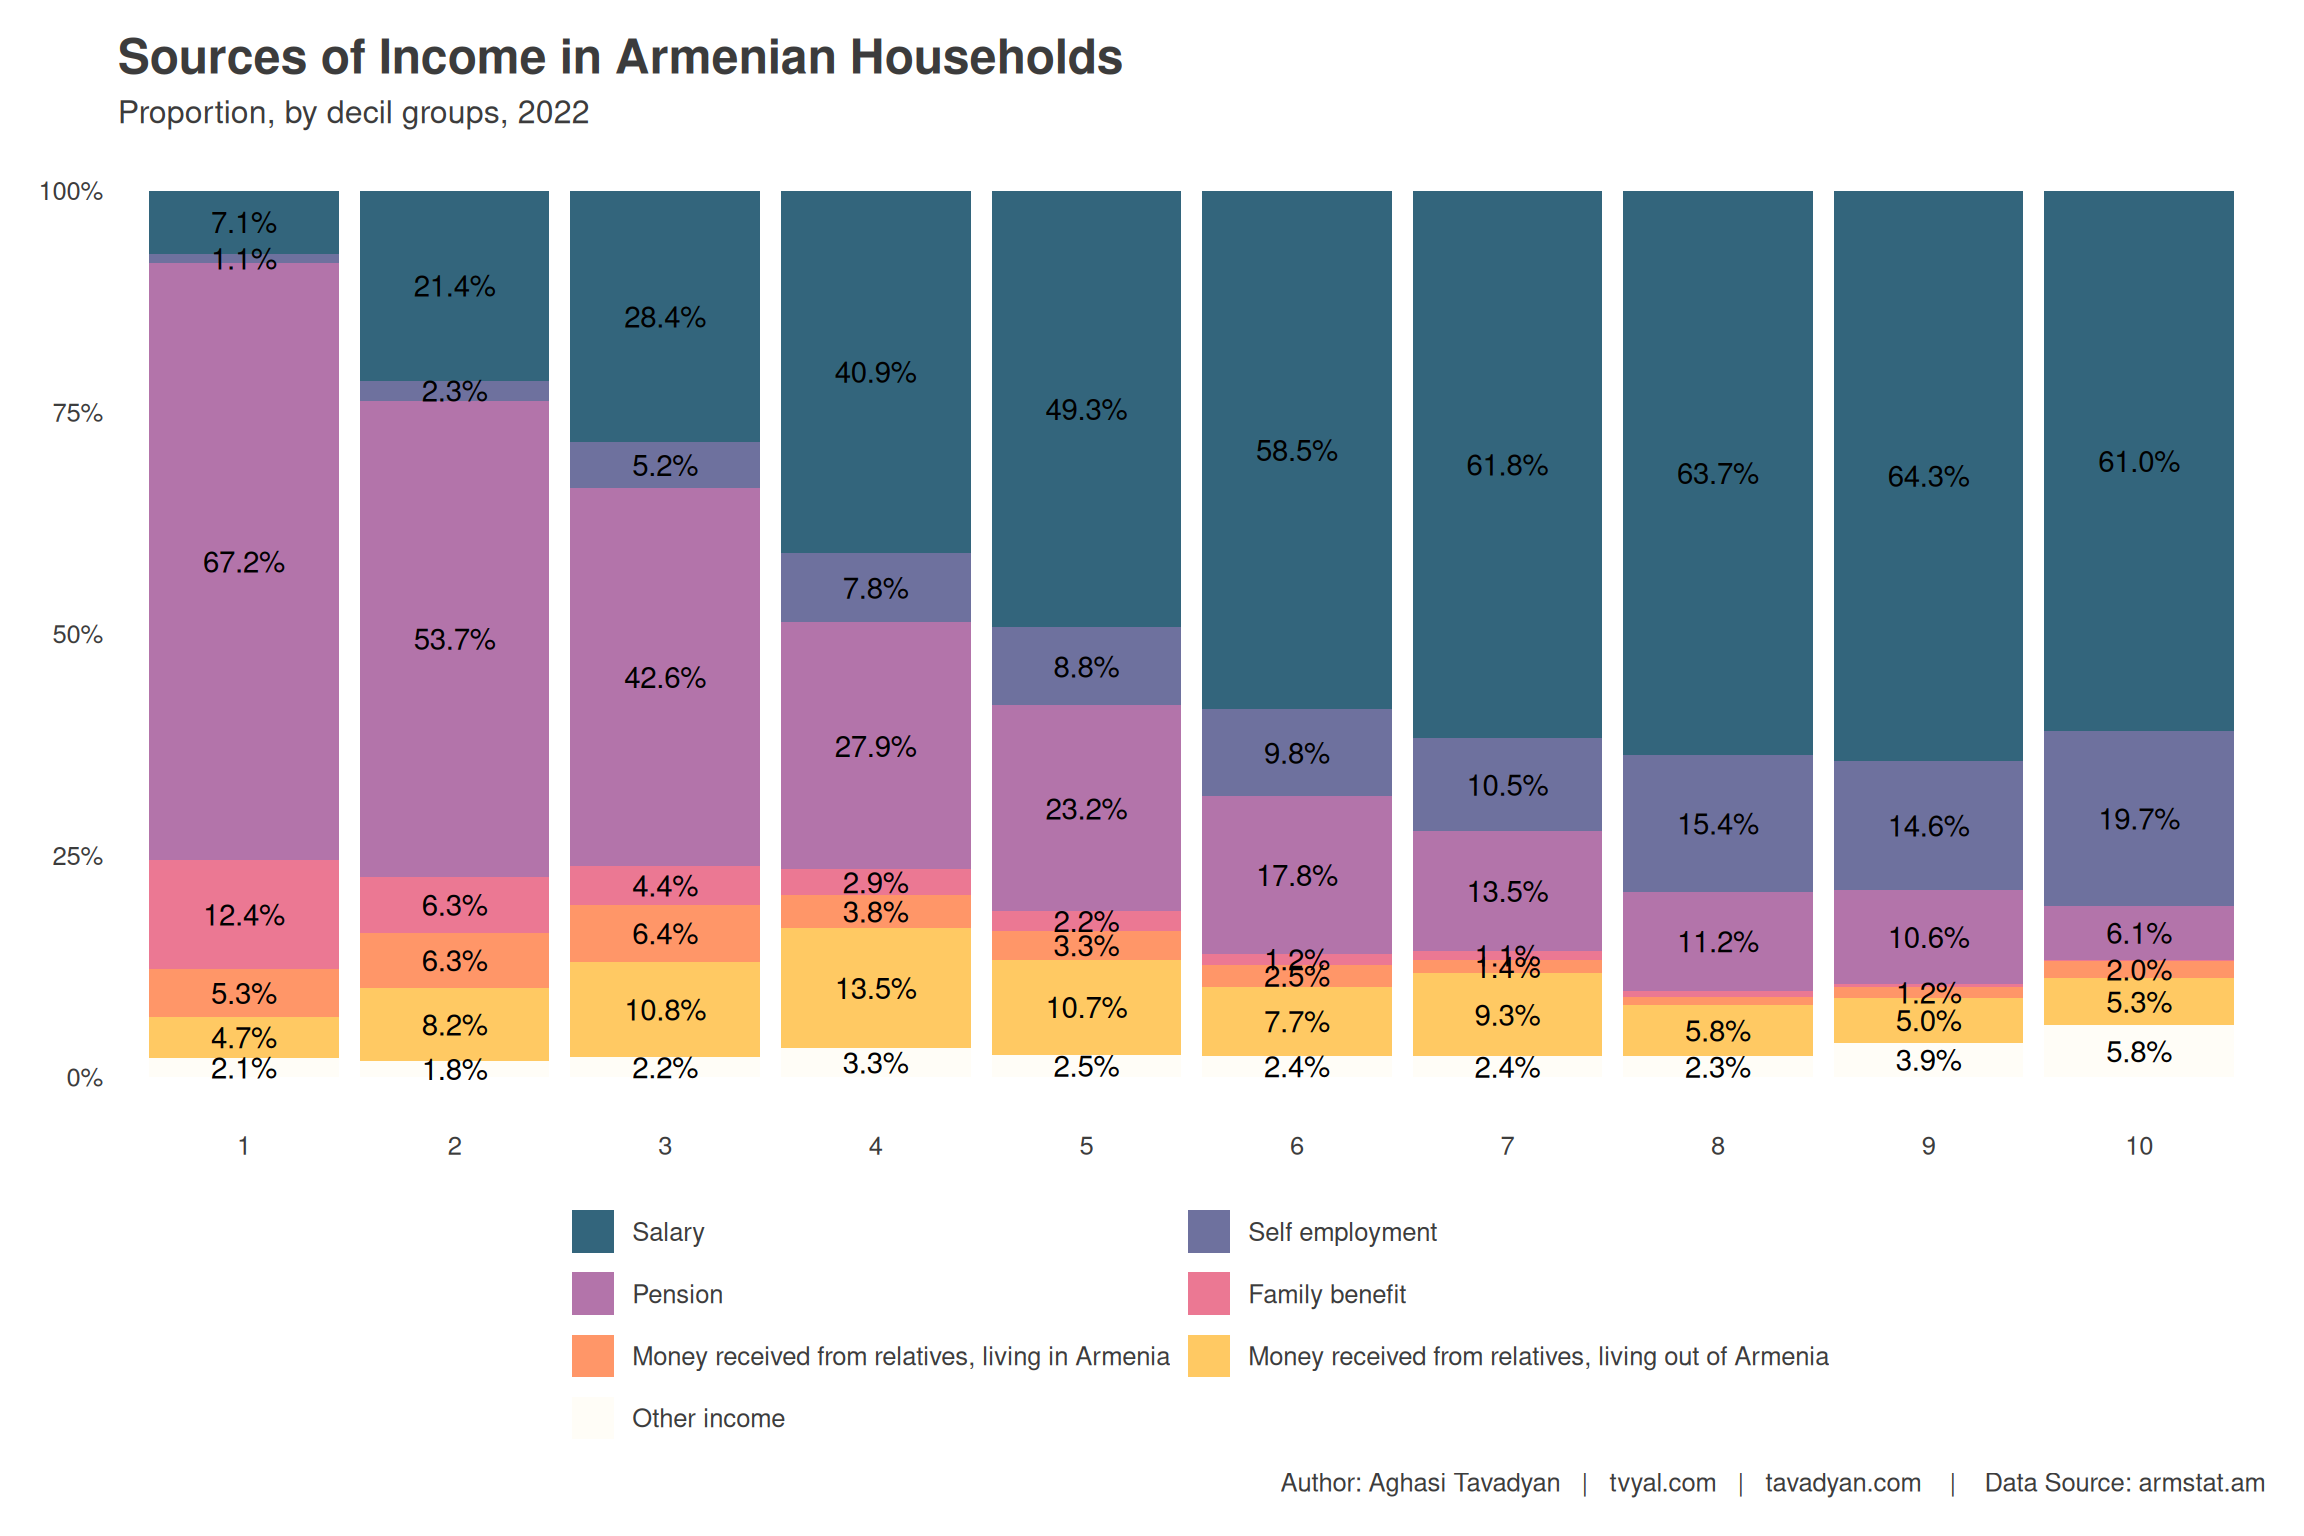
The more secure a household is, the larger the share of income derived from self-employment or business. It is noteworthy that in the 10th group, which represents the most secure 10 percent, the percentage share of income from wages is lower than in the 9th group. The most secure stratum is distinguished by a relatively large percentage of self-employed individuals. We also note that 1 percent of the income in this group is generated from the sale of real estate, which is included in the “other income” category in the plot.
Plot 3. Income Sources of Decile Groups, Percentage
*Note: Household incomes are formed from monetary and non-monetary sources. Decile groups were calculated based on total income. Plots 2 and 3 reflect only the distribution of monetary incomes by group. The average income for the decile groups in the first table was calculated using a weighted median.
The data for this analysis are taken from an official source, specifically, the anonymized microdata database of the Integrated Survey of Household Living Standards (Living Conditions) (by households). Household living standard indicators have been weighted. Calculations can be verified by visiting our GitHub page, where the data, calculation, and plot codes are provided.
Media Reports
There are no media reports this week.
English Summary
Study of Armenian Families
An incomplete family is considered a family consisting of one parent and a child.
Incomplete families are characterized by the following features:
- orphaned,
- parentless,
- divorced.
Let’s examine household incomes by decile group and the age-sex composition within those groups.
Families with a monthly income not exceeding 123 thousand drams fall into the 1st-2nd decile groups. This group is characterized by a large proportion of elderly individuals, with over 35 percent of their families consisting of retirees aged 63 and above. The average size of families in this group is 2 people. These families are mostly incomplete; only one-third in this group has a spouse. The lowest proportion of children is observed in this group, along with a lower share of working-age individuals.
Plot 1. Distribution of Households and Age Groups
Decile groups divide a database into ten equal parts,
each representing 10% of the total observations, in equal proportions.
The first decile represents the first 10% of the data, the second represents
the second 10%, and so on, with the 10th decile representing the highest 10% of the data.
As seen in the plot, the less income a household receives, the greater the likelihood that the number of elderly individuals in that household will be higher. For instance, in households earning less than 123 thousand drams, one-third are citizens aged 63 and above. Consequently, healthcare expenses are higher for this group.
The older the head of the household and the greater the probability that the head of the household is female, the higher the likelihood of the family falling into the disadvantaged stratum. Vulnerable households primarily consist of elderly women who do not have relatives, about 40 percent of whom have a basic education.
The affluent class is distinguished by larger families, as evidenced by the average family size of 5 people in the 10th decile group. Secure households also have a large number of working members, with more than three members being of working age. Furthermore, over 77 percent of the heads of secure families have a spouse. Thus, the presence of a complete family primarily characterizes an affluent family. The level of education is highest in the 10th decile, with 56.3 percent having a basic education.
The middle class is the foundation of society. This class has the highest number of children. Approximately 25 percent of the members of these families are children, in contrast to the affluent class, which has relatively fewer children. In the most secure 10th decile group, the percentage of children is 21 percent.
The presence of a complete family significantly influences the formation of the secure and middle classes, whereas loneliness is predominantly characteristic of the lower class.
Table 1. Demographic Analysis of RA Households
| Armenia’s Household Demographics | |||||||||||
| Summary of demographic and income information in 2022 | |||||||||||
| Household Decile | Average Monthly Income (in thousand AMD) | Demographic Information | Household Composition (Average) | Head of Household (HH) Details | |||||||
| Working-Age Population (%) | Senior Population (over 63, %) | Child Population (0-17, %) | Household Size | Working-Age | Children | Average Age of HH | Proportion of Female in HH (%) | HH with Basic Education (%) | Married HH (%) | ||
| 1 | 65.9 | 52.9% | 33.6% | 13.5% | 1.86 | 0.98 | 0.25 | 65 | 68.6% | 40.6% | 23.8% |
| 2 | 105.0 | 46.9% | 37.5% | 15.6% | 2.24 | 1.05 | 0.35 | 66 | 53.1% | 40.5% | 39.8% |
| 3 | 143.1 | 50.5% | 31.0% | 18.5% | 2.72 | 1.37 | 0.50 | 64 | 43.4% | 40.2% | 52.4% |
| 4 | 186.0 | 55.2% | 23.2% | 21.6% | 3.17 | 1.75 | 0.68 | 62 | 37.2% | 42.4% | 57.4% |
| 5 | 231.3 | 54.4% | 20.2% | 25.4% | 3.62 | 1.97 | 0.92 | 61 | 35.0% | 43.1% | 60.3% |
| 6 | 277.4 | 59.0% | 18.2% | 22.8% | 3.78 | 2.23 | 0.86 | 59 | 25.8% | 47.5% | 70.8% |
| 7 | 336.5 | 58.0% | 15.3% | 26.7% | 4.16 | 2.42 | 1.11 | 58 | 26.5% | 46.2% | 68.8% |
| 8 | 409.8 | 59.9% | 15.2% | 24.9% | 4.47 | 2.68 | 1.11 | 59 | 25.2% | 47.8% | 71.3% |
| 9 | 517.6 | 61.2% | 15.8% | 23.0% | 4.81 | 2.95 | 1.10 | 60 | 18.7% | 49.2% | 77.3% |
| 10 | 722.6 | 65.0% | 13.9% | 21.2% | 5.00 | 3.25 | 1.06 | 59 | 18.3% | 56.3% | 77.5% |
| — | — | — | — | — | — | — | — | — | — | — | — |
Note that this analysis is the second part of the household analysis.
Read the first analysis here:
🏠💰 📉 Households have become poorer.
As can be seen, the main monetary income for the first, second, and third decile groups, receiving a total income of up to 161 thousand drams, comes from pensions.*
The main source of income for the poorest 10 percent of households is pensions, which account for 67 percent of the income for households receiving up to 85 thousand drams; 12 percent comes from family benefits, and wages account for only 7 percent. It should be noted that in this group, the average income from pensions per household is 28 thousand drams. This does not mean that retirees in this group receive an average of 28 thousand drams. It simply means that some households in this group do not have retirees over 63 and thus do not receive pensions. The same applies to the average income from wages. According to the household database, in 2022, the average pension for retirees over 63 was 46,245 drams.
Plot 2. Income Sources of Decile Groups, Drams
More than 10 percent of the monetary income for the 3rd to 5th decile groups comes from relatives living abroad. This is the largest specific weight. This income is received from migrant workers.
The more secure a household is, the larger the share of income derived from self-employment or business. It is noteworthy that in the 10th group, which represents the most secure 10 percent, the percentage share of income from wages is lower than in the 9th group. The most secure stratum is distinguished by a relatively large percentage of self-employed individuals. We also note that 1 percent of the income in this group is generated from the sale of real estate, which is included in the “other income” category in the plot.
Plot 3. Income Sources of Decile Groups, Percentage
*Note: Household incomes are formed from monetary and non-monetary sources. Decile groups were calculated based on total income. Plots 2 and 3 reflect only the distribution of monetary incomes by group. The average income for the decile groups in the first table was calculated using a weighted median.
The data for this analysis are taken from an official source, specifically, the anonymized microdata database of the Integrated Survey of Household Living Standards (Living Conditions) (by households). Household living standard indicators have been weighted. Calculations can be verified by visiting our GitHub page, where the data, calculation, and plot codes are provided.