📈📉❓ 55.3 Percent Export Growth or -12.2 Percent Decline?
Structural Changes in Armenia’s Trade Turnover
Over the past two years, the structure of Armenia’s trade turnover has undergone significant changes. In 2023, exports grew by a substantial 55.3 percent, increasing from $5.4 billion (2022) to $8.4 billion. Concurrently, imports rose by 40.2 percent, reaching $12.3 billion from $8.8 billion during the same period. Over the last two years, exports and imports have increased by 2.8 and 2.3 times, respectively. Significant structural changes are also present in the trade turnover.
Figure 1. Armenia’s trade turnover has more than doubled in 2 years
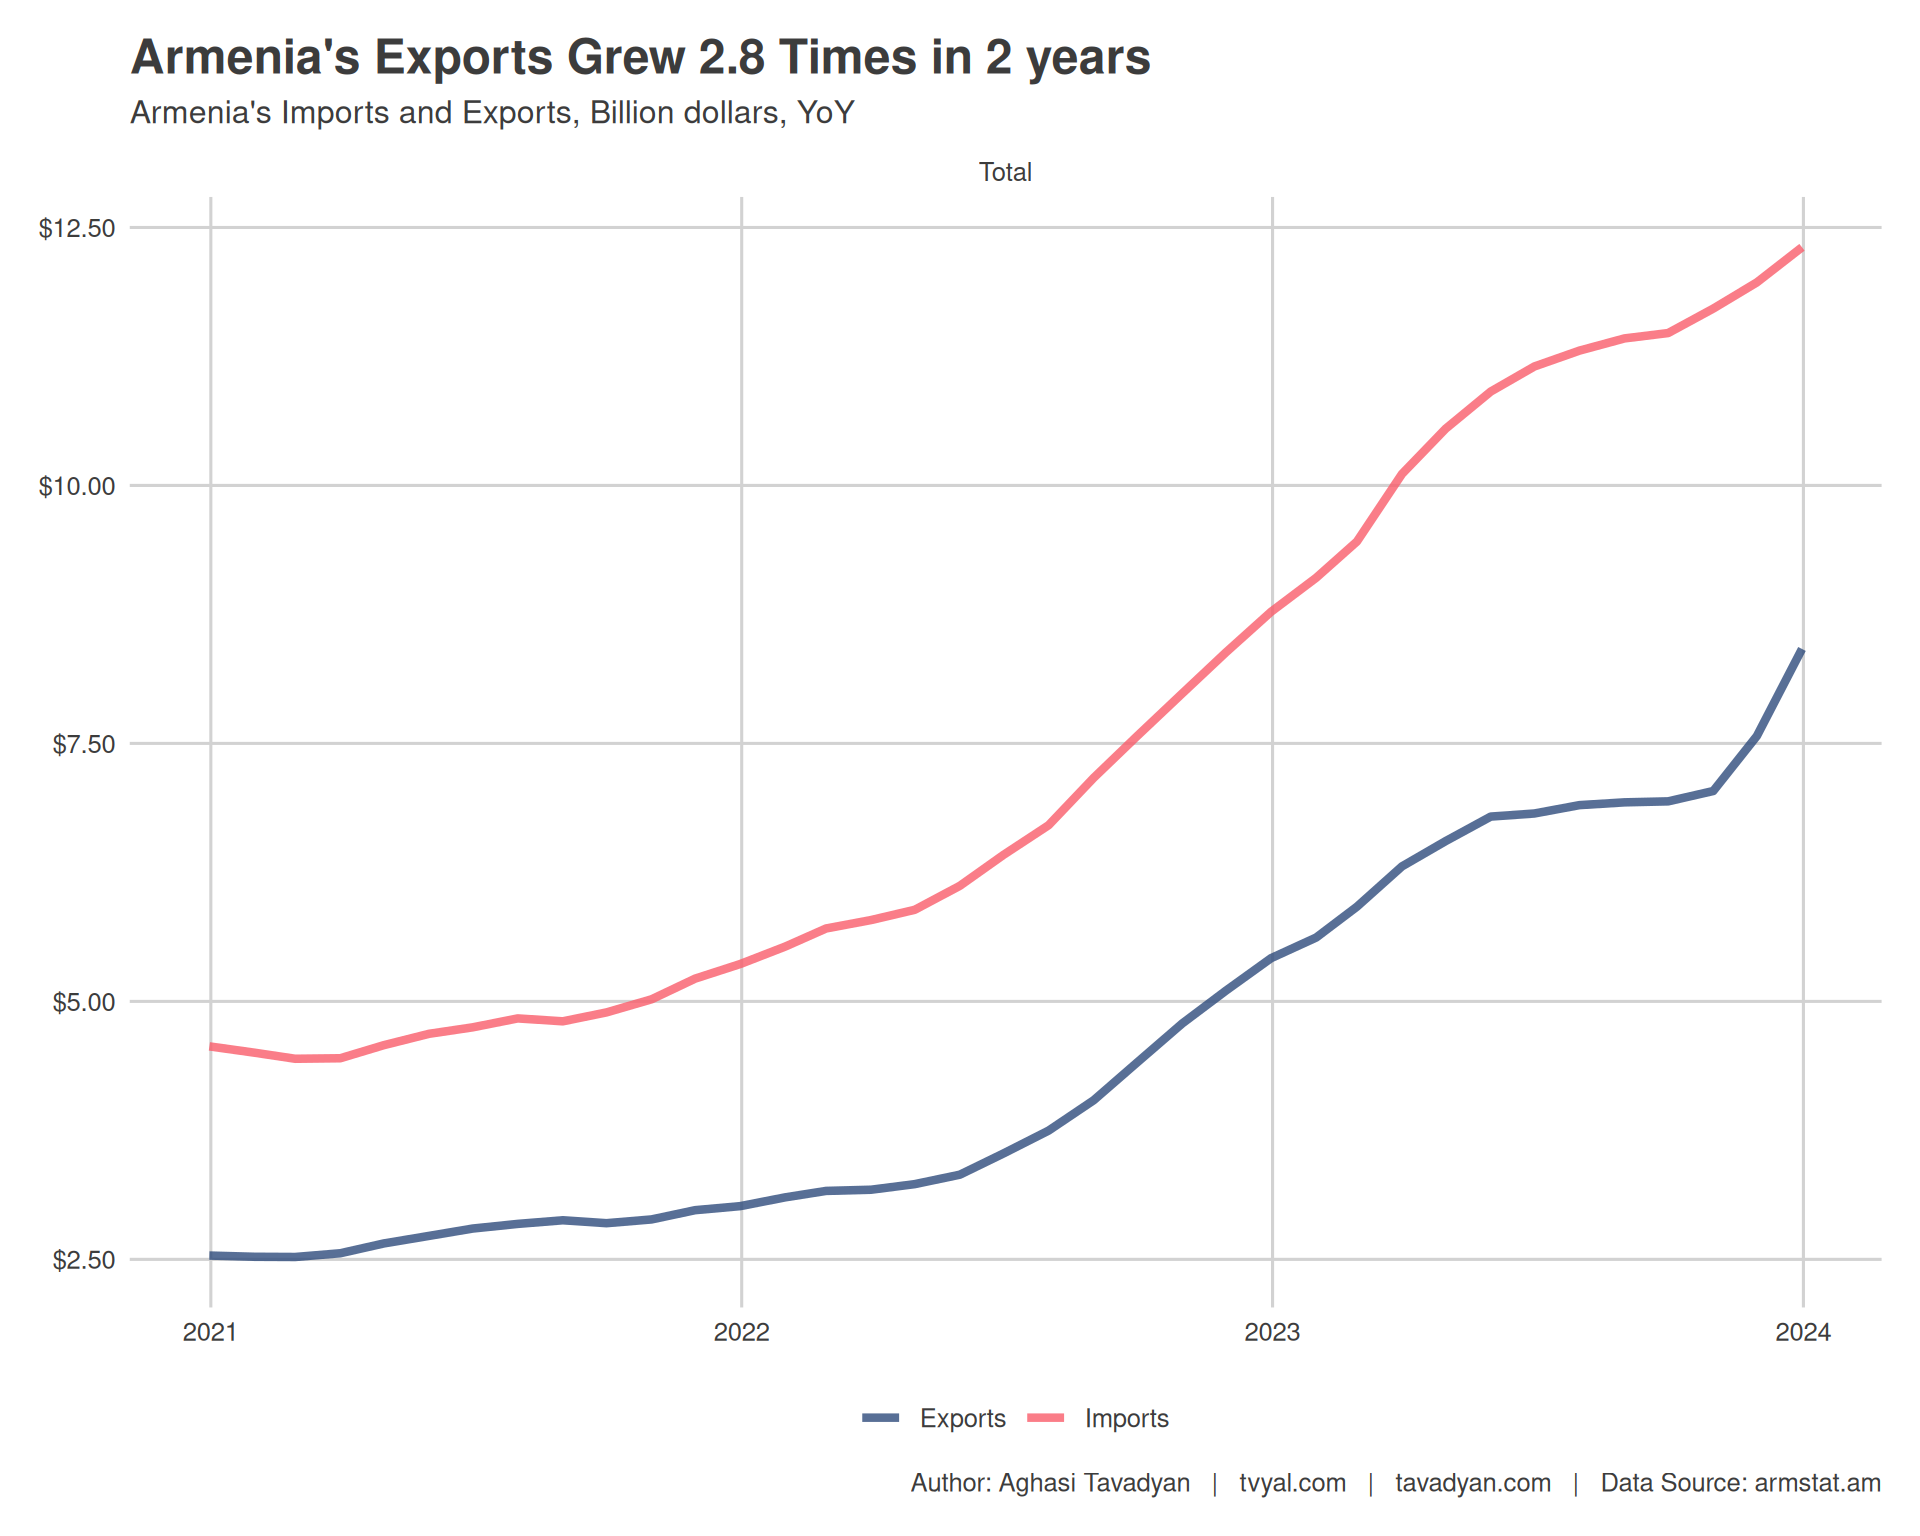
It is noteworthy that a significant portion of the export growth in 2023, 31 percent or $2.6 billion, occurred in the last two months, specifically November and December. This growth is reflected in the chart, where the export curve, which had not shown a strong upward trend from May to September, sharply breaks upwards during this period. It is also remarkable that as of December 2023, Armenia reached a historic milestone: exports for that month exceeded imports for the first time. Without this sudden surge, our forecast in September 2023 was that exports for 2023 would be around $7.1 billion.
Russia, UAE, and Hong Kong accounted for 75 percent of exports in 2023
In 2023, 34.4 percent of Armenia’s exports, more than one-third, went to the United Arab Emirates (UAE) and Hong Kong. The largest export destination was Russia, accounting for 40.6 percent. Thus, these three countries accounted for 75 percent of exports in 2023. It is worth noting that in 2021, only 2.8 percent of exports were recorded to the UAE and Hong Kong ($84 million). We have effectively seen a 35-fold increase in exports to the UAE and Hong Kong over two years (see Figure 2).
While the overall growth in imports and exports exceeded 40 percent in 2023, the reality is more nuanced. If we exclude Russia, the UAE, and Hong Kong from the trade turnover, exports to other countries decreased by 12.2 percent in 2023, which is concerning and a noticeable deviation from the overall growth trend. For the last two years, excluding these three countries, export growth was only 0.6 percent, compared to an overall 2.8-fold increase. This fact does not indicate sustainable export growth.
Figure 2. Dynamics of RA Exports and Imports by Main Partners
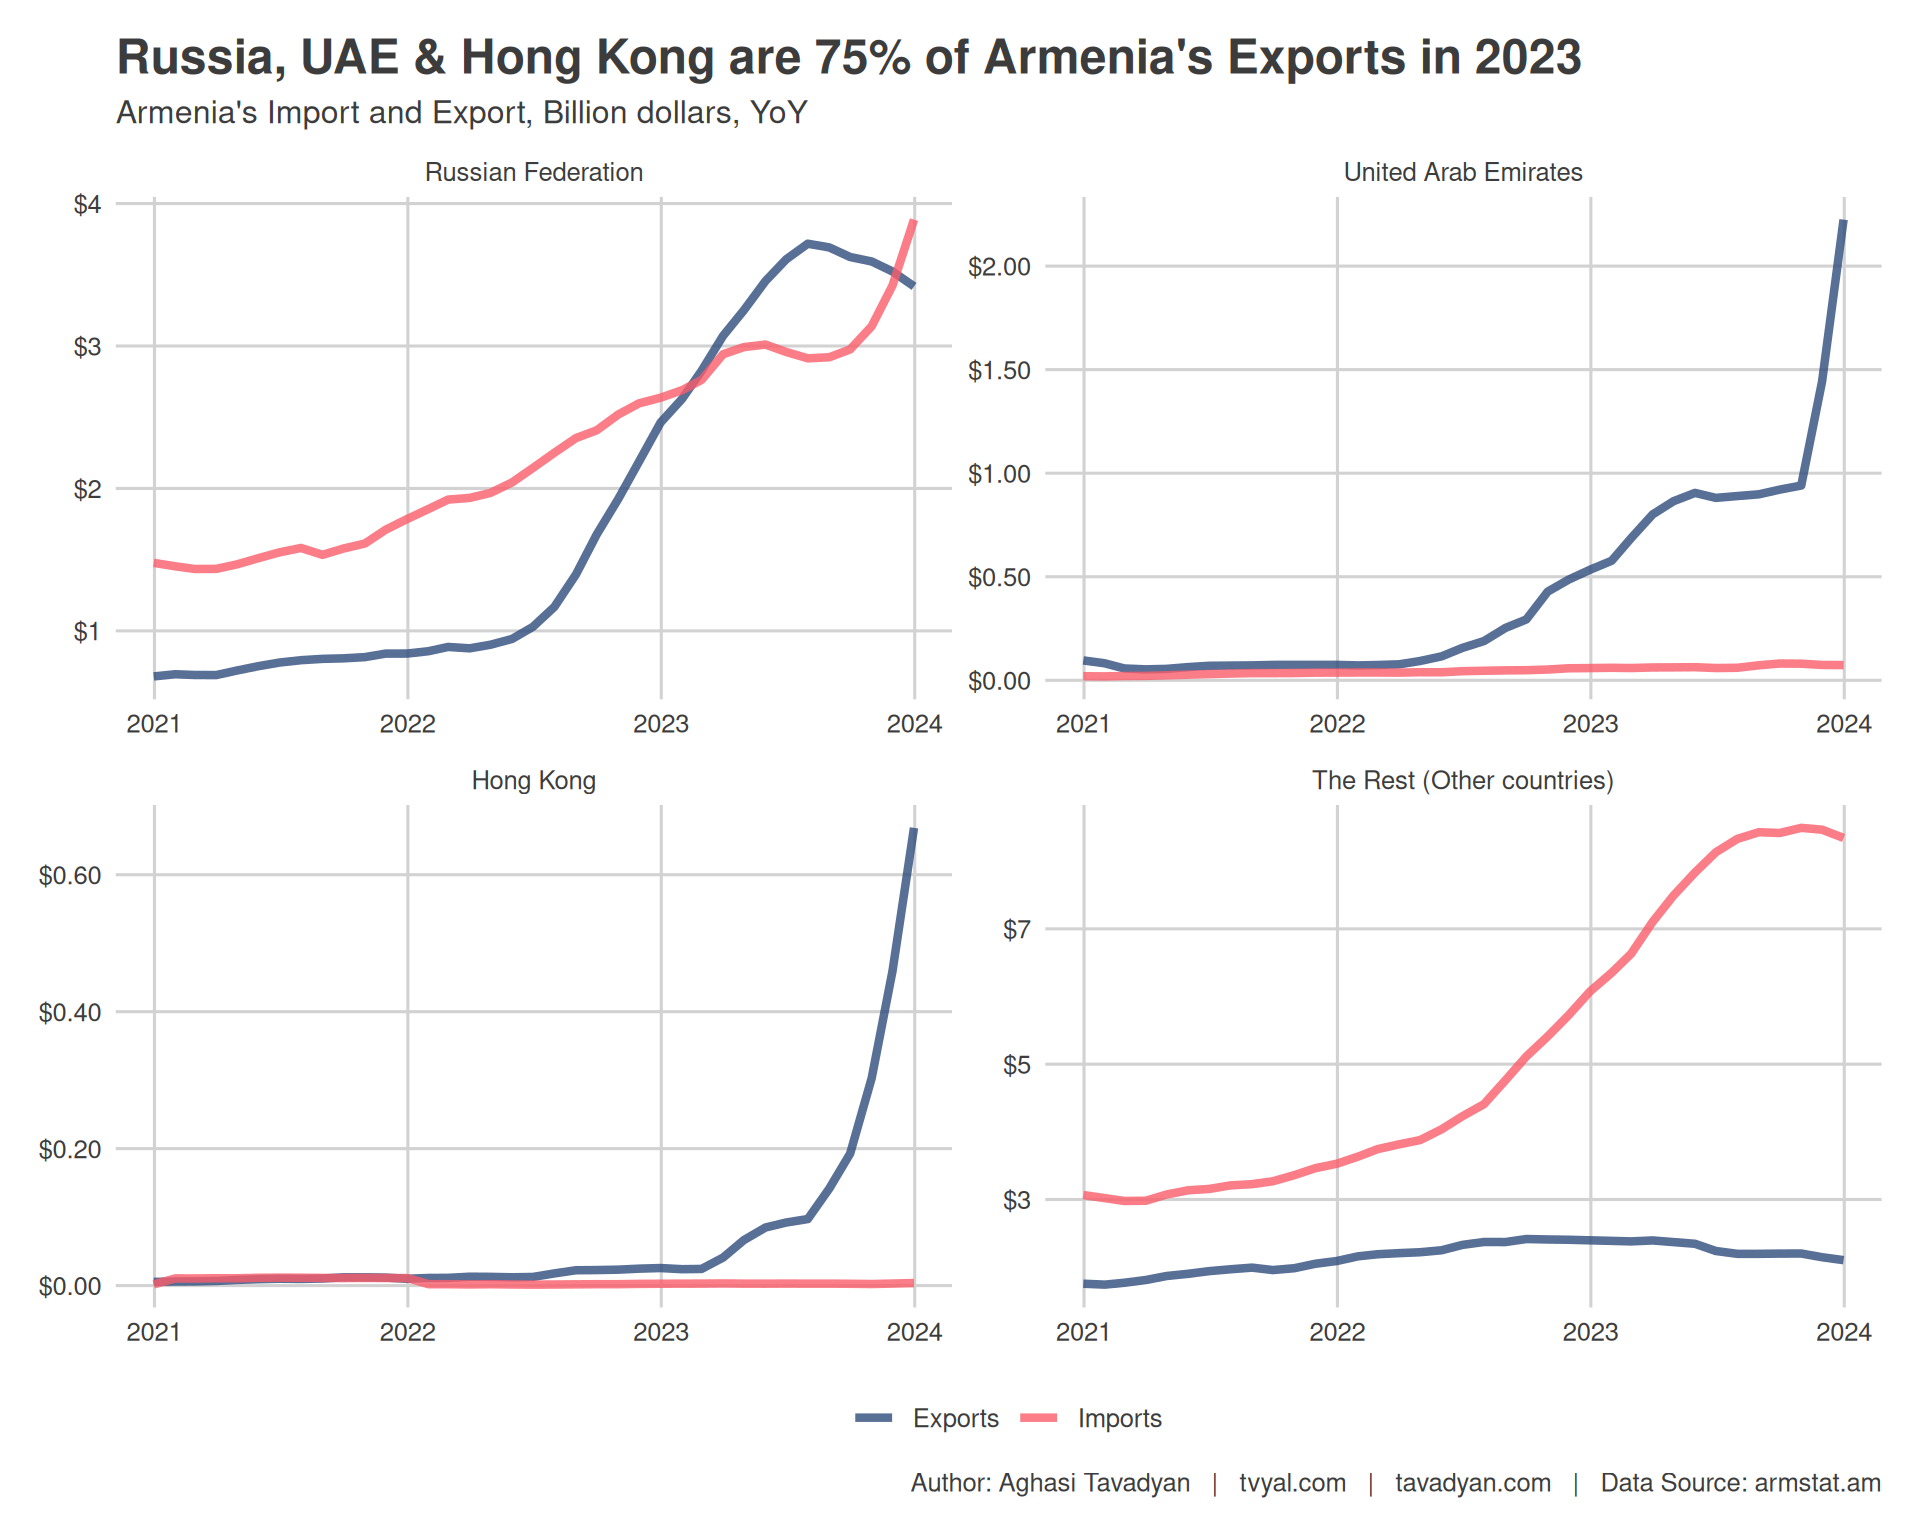
Exports decreased by -12.2 percent in 2023 if Russia, UAE, and Hong Kong are excluded
Over the past two years, export growth has been recorded exclusively to Russia, the UAE, and Hong Kong. A significant 6.8-fold increase was registered to these countries, from $0.9 billion (2021) to $6.3 billion.
Turning to imports, it is important to note that the UAE and Hong Kong played a minimal role in Armenia’s import dynamics, which primarily originated from Russia. A portion of imports from Russia was re-exported to the UAE and Hong Kong, which is one of the reasons for the structural change in exports over the last two years.
You can also read about Armenia’s export structure in this material: Alternative Export Destinations
In 2023, exports to EAEU countries increased by over 42.9 percent (from $2,564 million to $3,609 million USD). 42.9% of Armenia’s total export volume is directed to the EAEU. Russia is Armenia’s main trade partner, and the share of exports to Russia is the most diversified, with mainly finished products being exported to Russia. Exports to the Middle East increased 2.6 times in 2023 (from $983 million to $2,538 million USD), primarily due to re-exports from Russia to the UAE. Exports to Greater China increased 2.8 times, mainly due to re-exports from Russia to Hong Kong. It should be noted that as of the end of 2023, the European Union ranks fourth among partner regions for exports (see Table 1). In 2023, only 8.4 percent of Armenia’s exports went to the EU.
Table 1. Armenia’s Export Dynamics
| Armenia’s Exports Dinamics in 2021-2022 | |||||||
| Exports | 2021 | 2022 | 2023 | ||||
| Partner Regions | Million USD | Million USD | % growth | % from total | Million USD | % growth | % from total |
| EAEU | 882.6 | 2,564.1 | 190.5% | 47.3% | 3,609.3 | 40.8% | 42.9% |
| EU | 656.1 | 772.7 | 17.8% | 14.3% | 709.5 | −8.2% | 8.4% |
| Greater China | 403.1 | 395.1 | −2.0% | 7.3% | 1,093.8 | 176.8% | 13.0% |
| Middle East | 351.4 | 983.2 | 179.8% | 18.1% | 2,538.2 | 158.2% | 30.2% |
| Other countries | 722.8 | 703.9 | −2.6% | 13.0% | 464.3 | −34.0% | 5.5% |
| Total | 3,016.0 | 5,419.1 | 79.7% | 100.0% | 8,415.2 | 55.3% | 100.0% |
| — | — | — | — | — | — | — | — |
| It should be noted that while cognac was traditionally the main export to the Russian Federation until 2021, a shift towards technologically advanced goods as primary exports occurred in 2022-23. Notably, items such as phones, cars, medical devices, and radio equipment have taken a leading position. During the same period, exports of machinery and equipment to Russia increased more than 10-fold, while categories such as chemicals, plastics, ceramics, glass, and metals grew more than 3-fold. The increase in re-exports of machinery and equipment significantly contributed to export growth. It is worth mentioning that re-export restrictions on cars imposed by Georgia and Russia since August 2023 have halted the movement of car re-exports to the Russian Federation. No car re-exports are expected in 2024. |
🚗💨 The Death of Armenia’s “Car Manufacturing”
While overall statistics show significant growth in trade turnover, a detailed examination reveals various concerning trends. From the second figure, it is evident that if we consider other countries (excluding Russia, the Emirates, and Hong Kong), there was indeed positive import growth in 2023 compared to 2022. However, a more detailed study reveals a worrying trend: in 2023, there is a negative trend in import growth to other countries, and exports to other destinations decreased by 12.2 percent. Thus, all else being equal, it can be expected that both imports and exports to other countries may decrease in 2024.
* All data in this analysis are taken from official sources, specifically the NSS foreign trade database (UAE, Hong Kong). The calculations are fully available on GitHub; they can be verified by visiting our GitHub page, where the data, calculation, and plot codes are provided.