Armenia: A Haven for Russian Gold
In 2024, 88 percent of Russian gold exports passed through Armenia
Introduction
In recent years, significant changes have occurred in the global gold trade, as a result of which Armenia has become an important player in the redistribution of Russian gold exports. This transformation is largely due to the geopolitical changes that took place in 2022, specifically the sanctions following Russia’s military operations in Ukraine. This analysis explores the evolving dynamics of the gold trade between Russia and Armenia, using a methodology based on official data and mirror statistics.
Part 1. Russian Gold Export Patterns
Until 2022, Russian gold export patterns were relatively stable and predictable. As shown in the first chart, from 2019 to 2021, Russian gold was primarily exported to the United Kingdom. In 2019, 91.5% of Russian gold (HS code 7108: Gold: unwrought or in semi-manufactured forms, or in powder form) was exported to the United Kingdom. This trend continued in 2020 and 2021 with 90.8% and 88.1% of exports going to the United Kingdom respectively.
Chart 1.
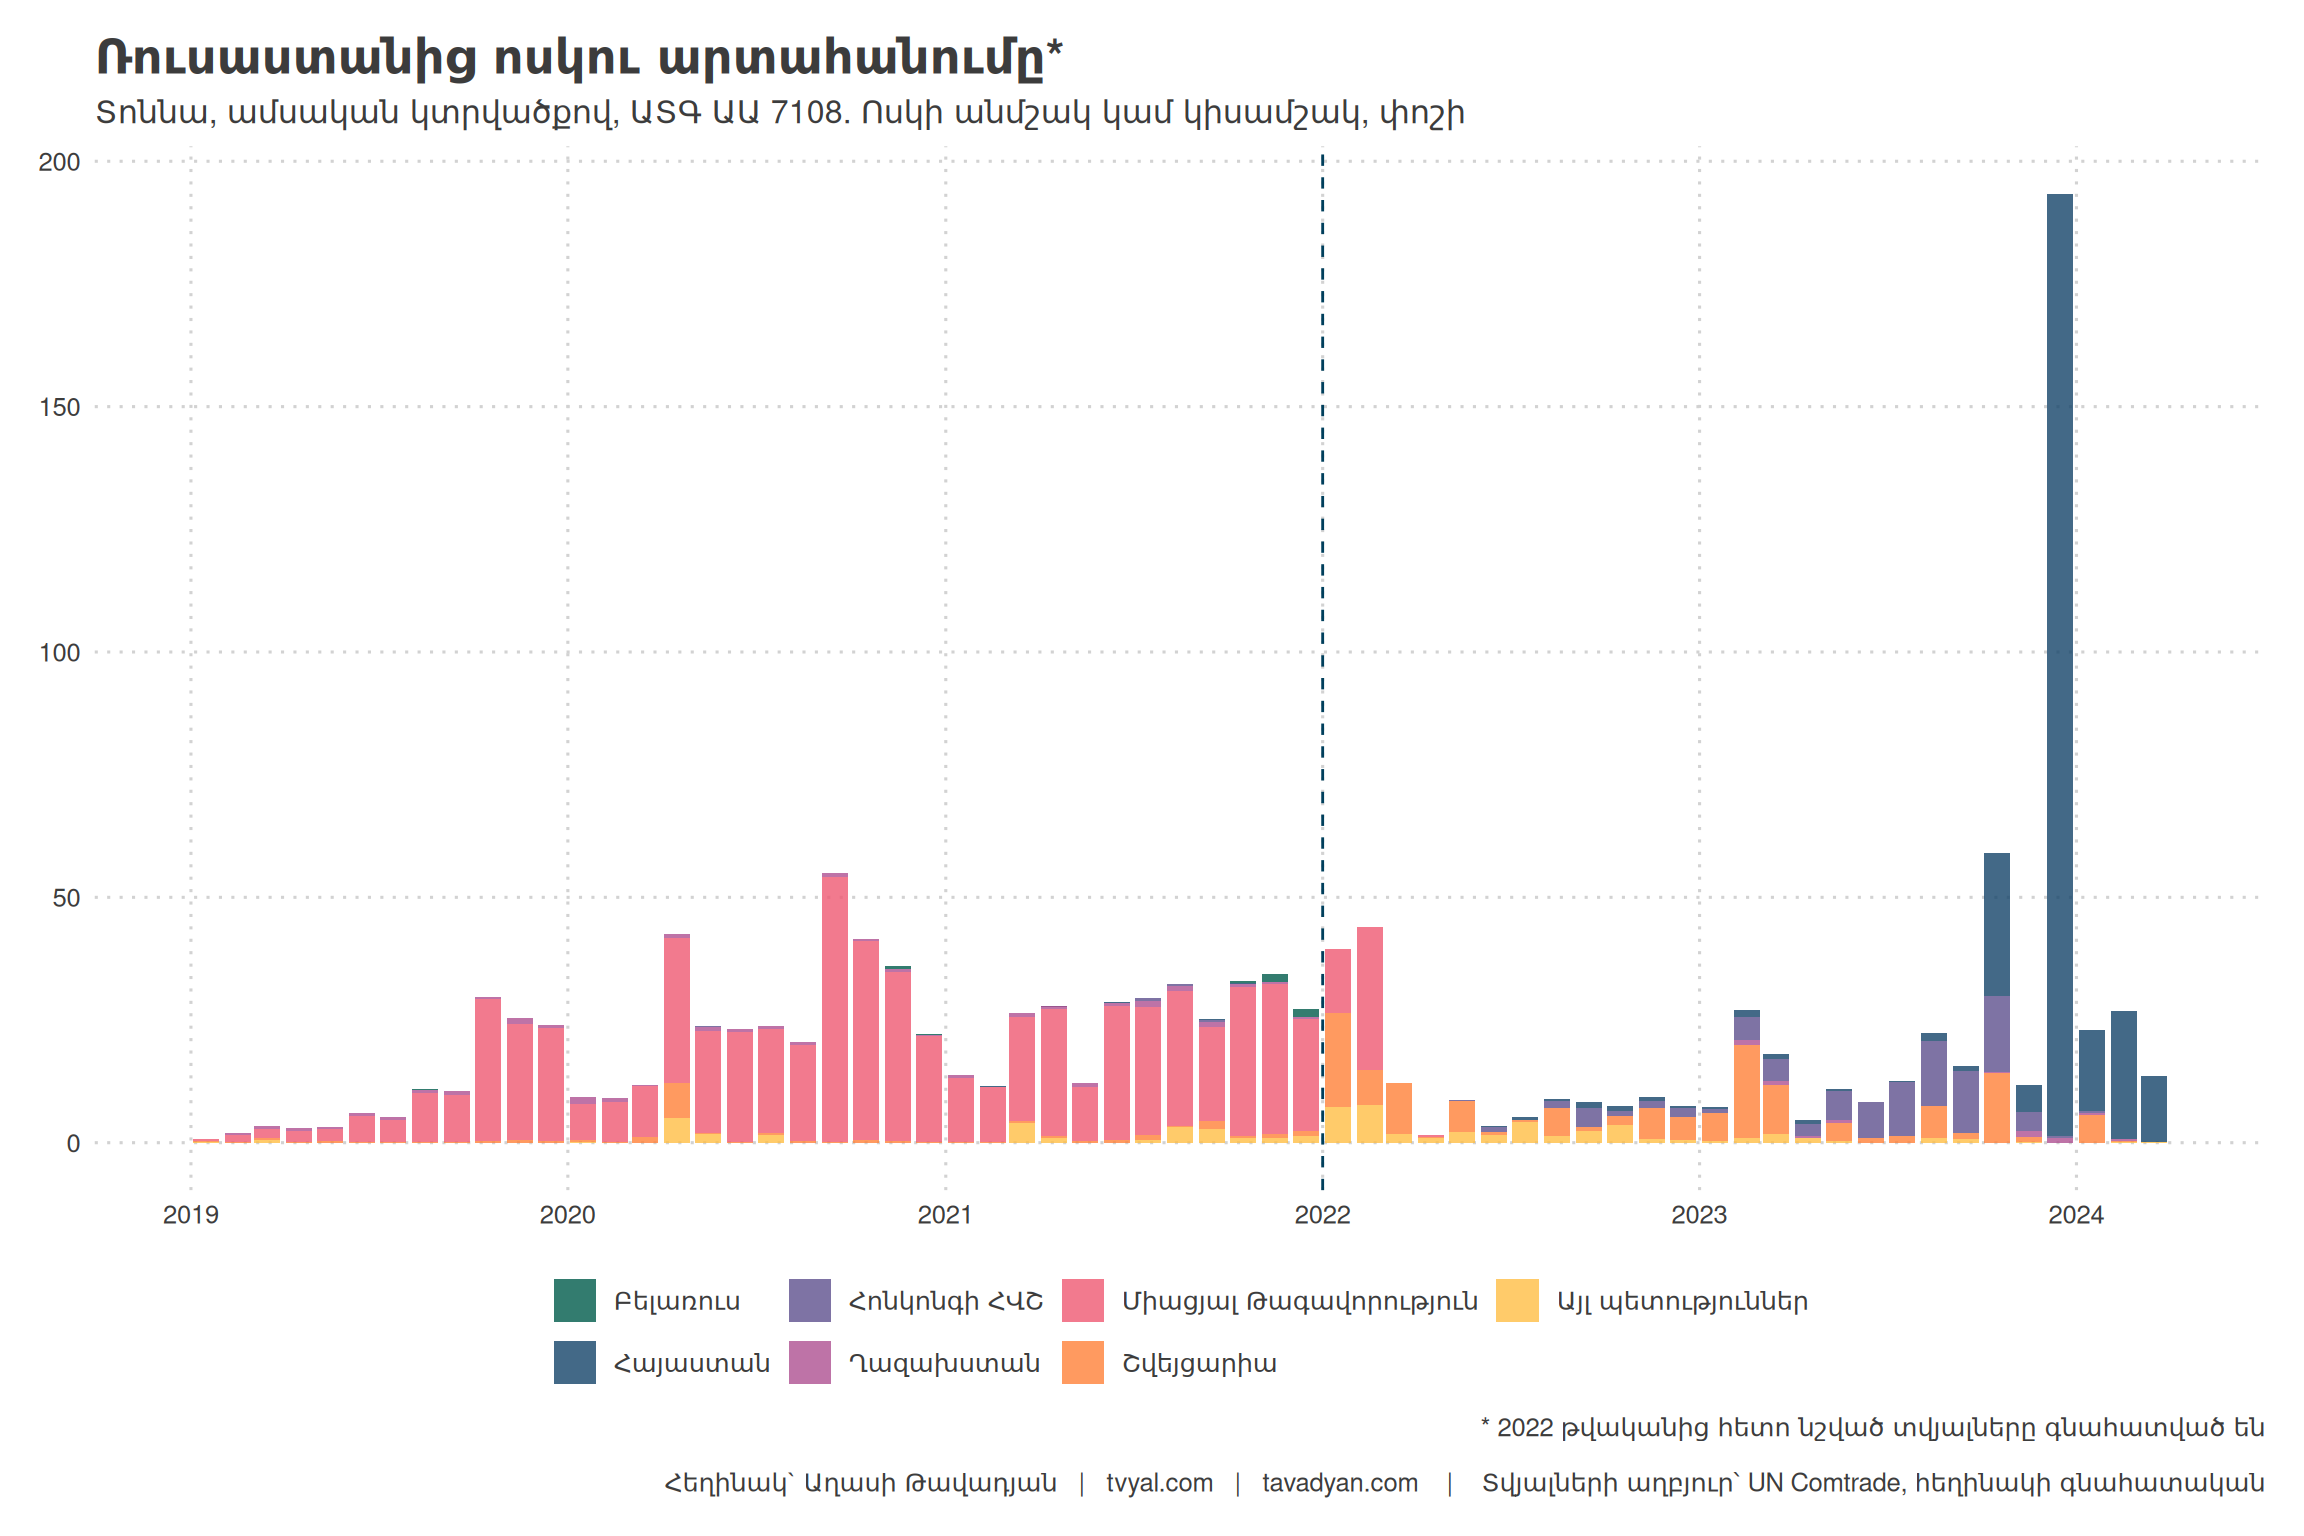
However, in 2022, the situation changed drastically. Sanctions imposed on Russia led to rapid diversification of gold export destinations. A sharp decline in exports to the United Kingdom was recorded, coupled with the emergence of significant new partners, including Armenia.
The transformation becomes more apparent when we look at the annual data, as presented in the second chart. In 2022, a fragmentation of Russian gold exports occurred among several countries, where Switzerland became the largest importer (41.0%), followed by the United Kingdom (27.3%) and other countries.
Chart 2.

The most remarkable development occurred in 2023 and continued into 2024. Armenia, which was previously a secondary player in Russian gold exports, suddenly became the predominant destination. In 2023, 59.7% of Russian gold exports were directed to Armenia. This trend strengthened in the first quarter of 2024, when a significant 88.4% of Russian gold exports passed through Armenia.
Part 2. Armenia’s Gold Re-exports: A Sudden Surge
This surge in gold exports to Armenia coincides with a dramatic increase in Armenia’s overall export figures. As noted in our previous analysis, Armenia’s overall exports have grown exponentially:
- 2021: 3 billion USD
- 2022: 5.4 billion USD
- 2023: 8.4 billion USD
- 2024 (forecast): about 18 billion USD
However, it is important to understand that this growth is mainly driven by gold re-exports. In fact, in the first four months of 2024, about 76% of Armenia’s exports consisted of the re-export of precious and semi-precious stones and metals, primarily to the United Arab Emirates, Hong Kong, and China.
Chart 3.
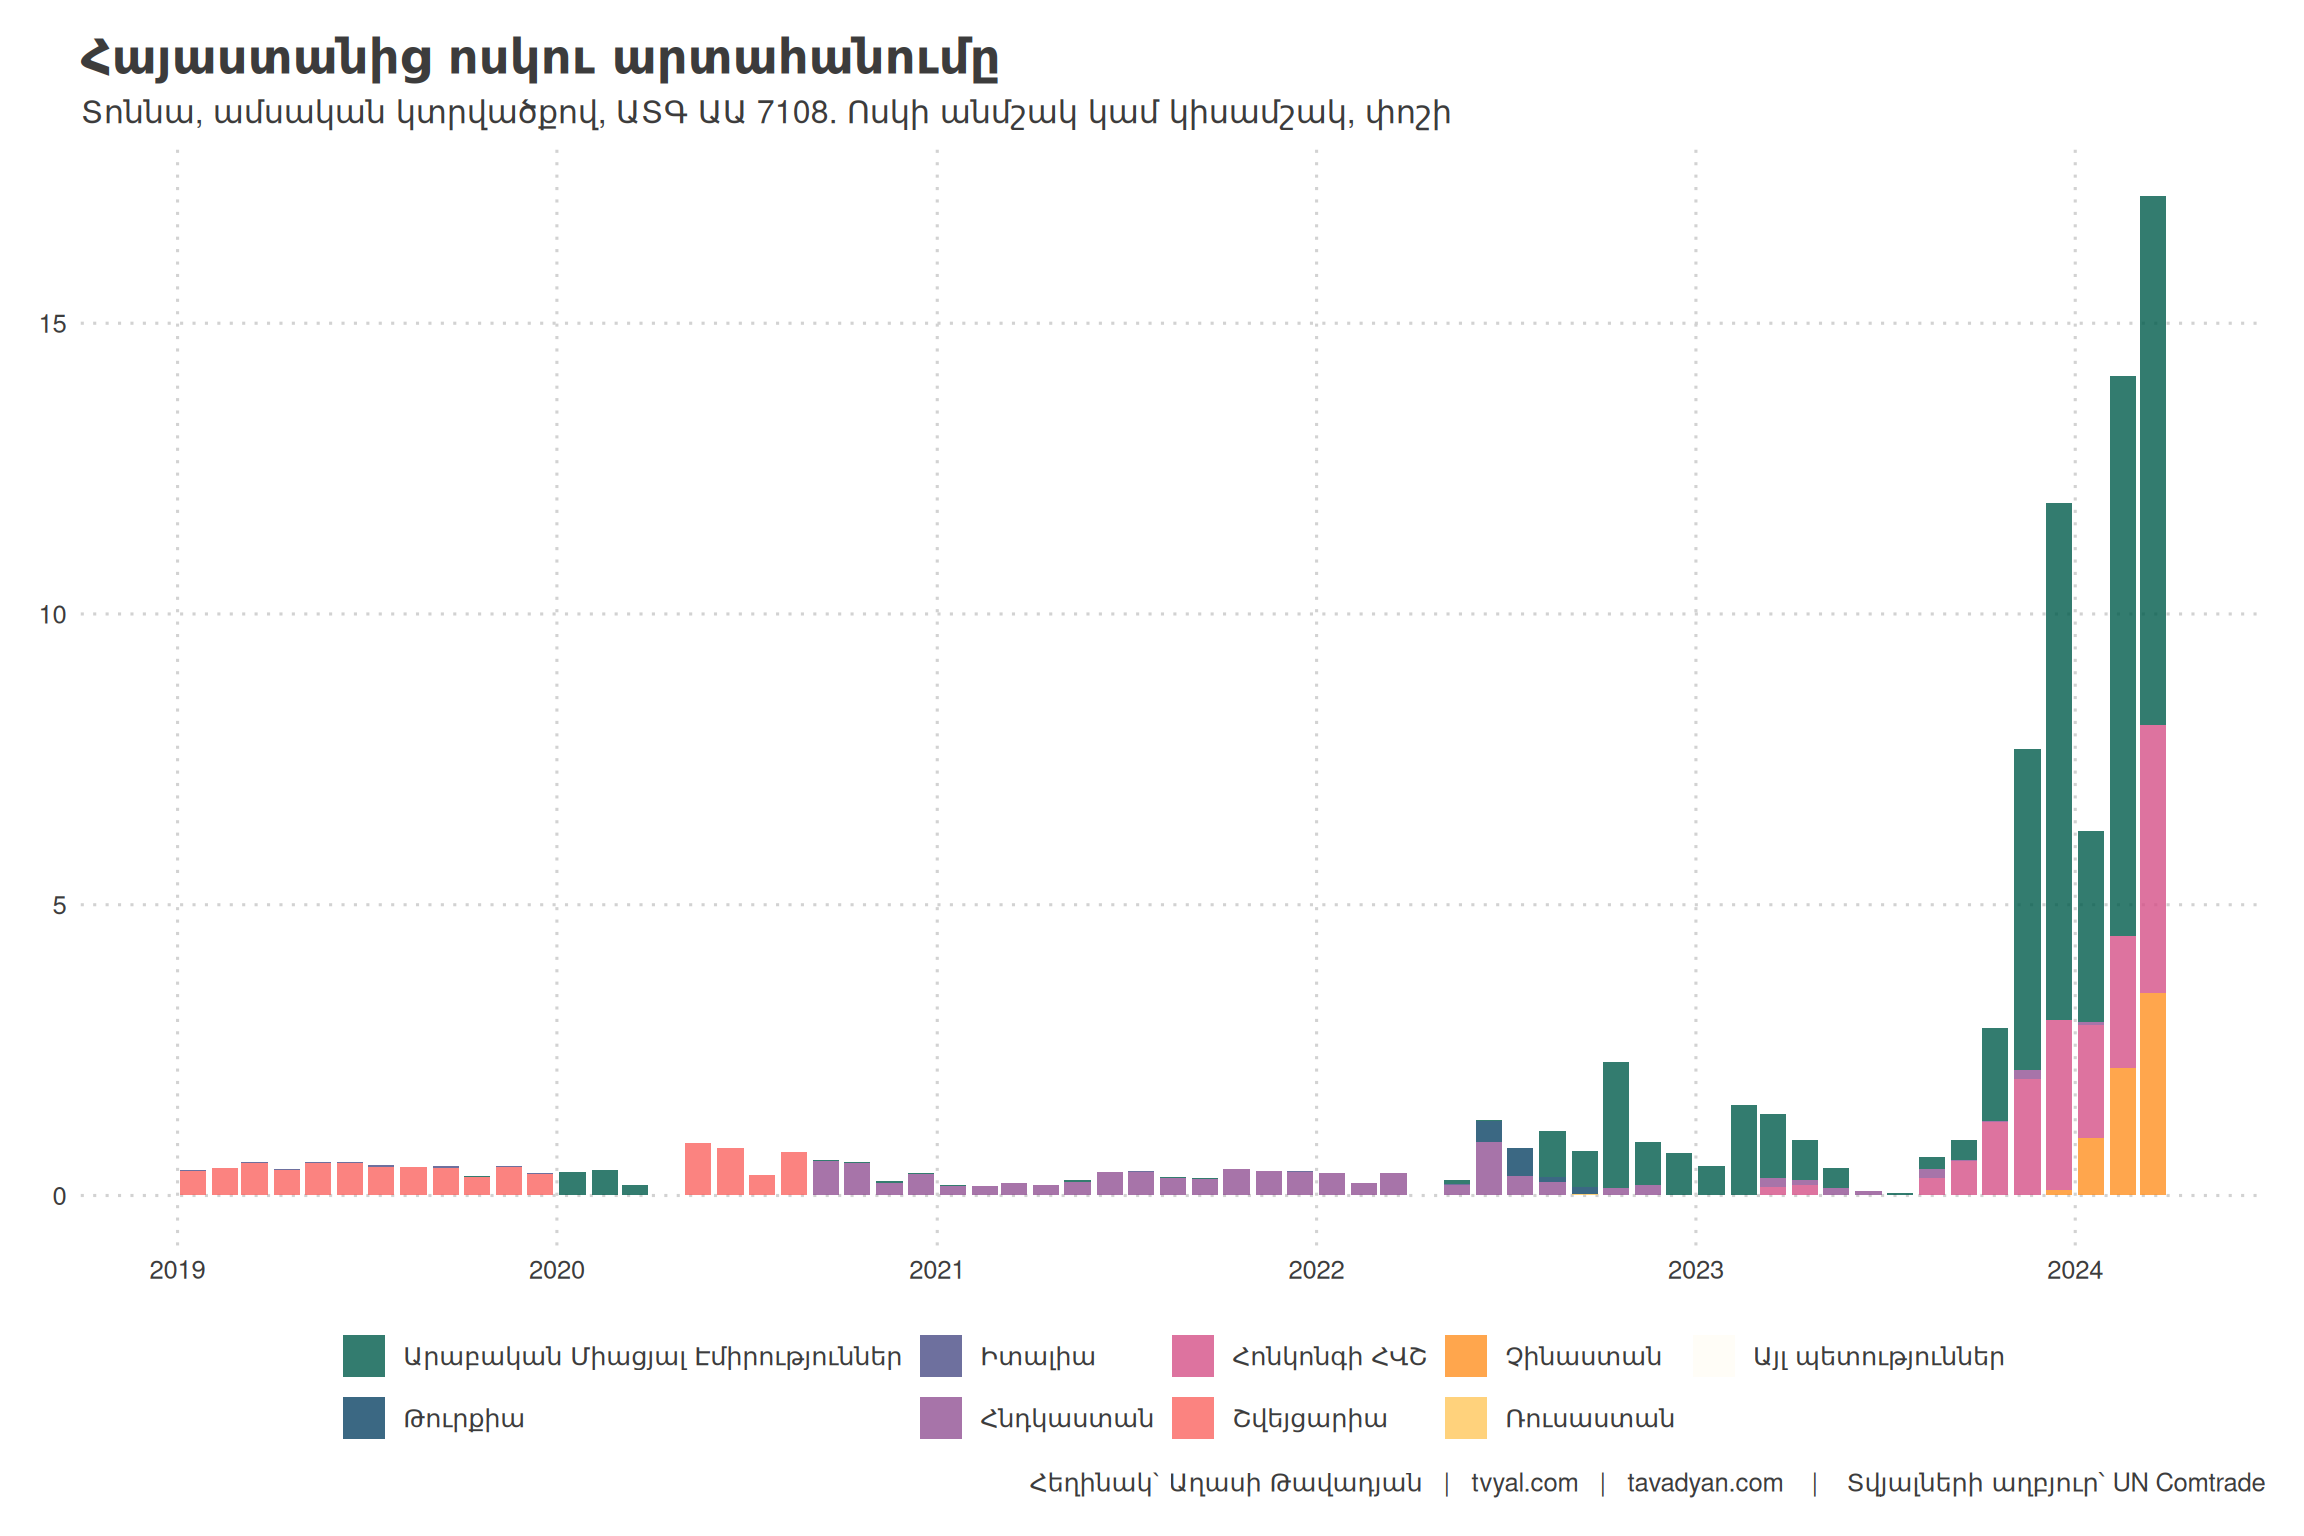
The third chart shows a dramatic shift in Armenia’s gold export patterns. The data reveals a sharp increase starting in late 2023: export volumes reached unprecedented levels in early 2024. This monthly breakdown reveals Armenia’s rapidly changing role in the international gold trade.
Chart 4.
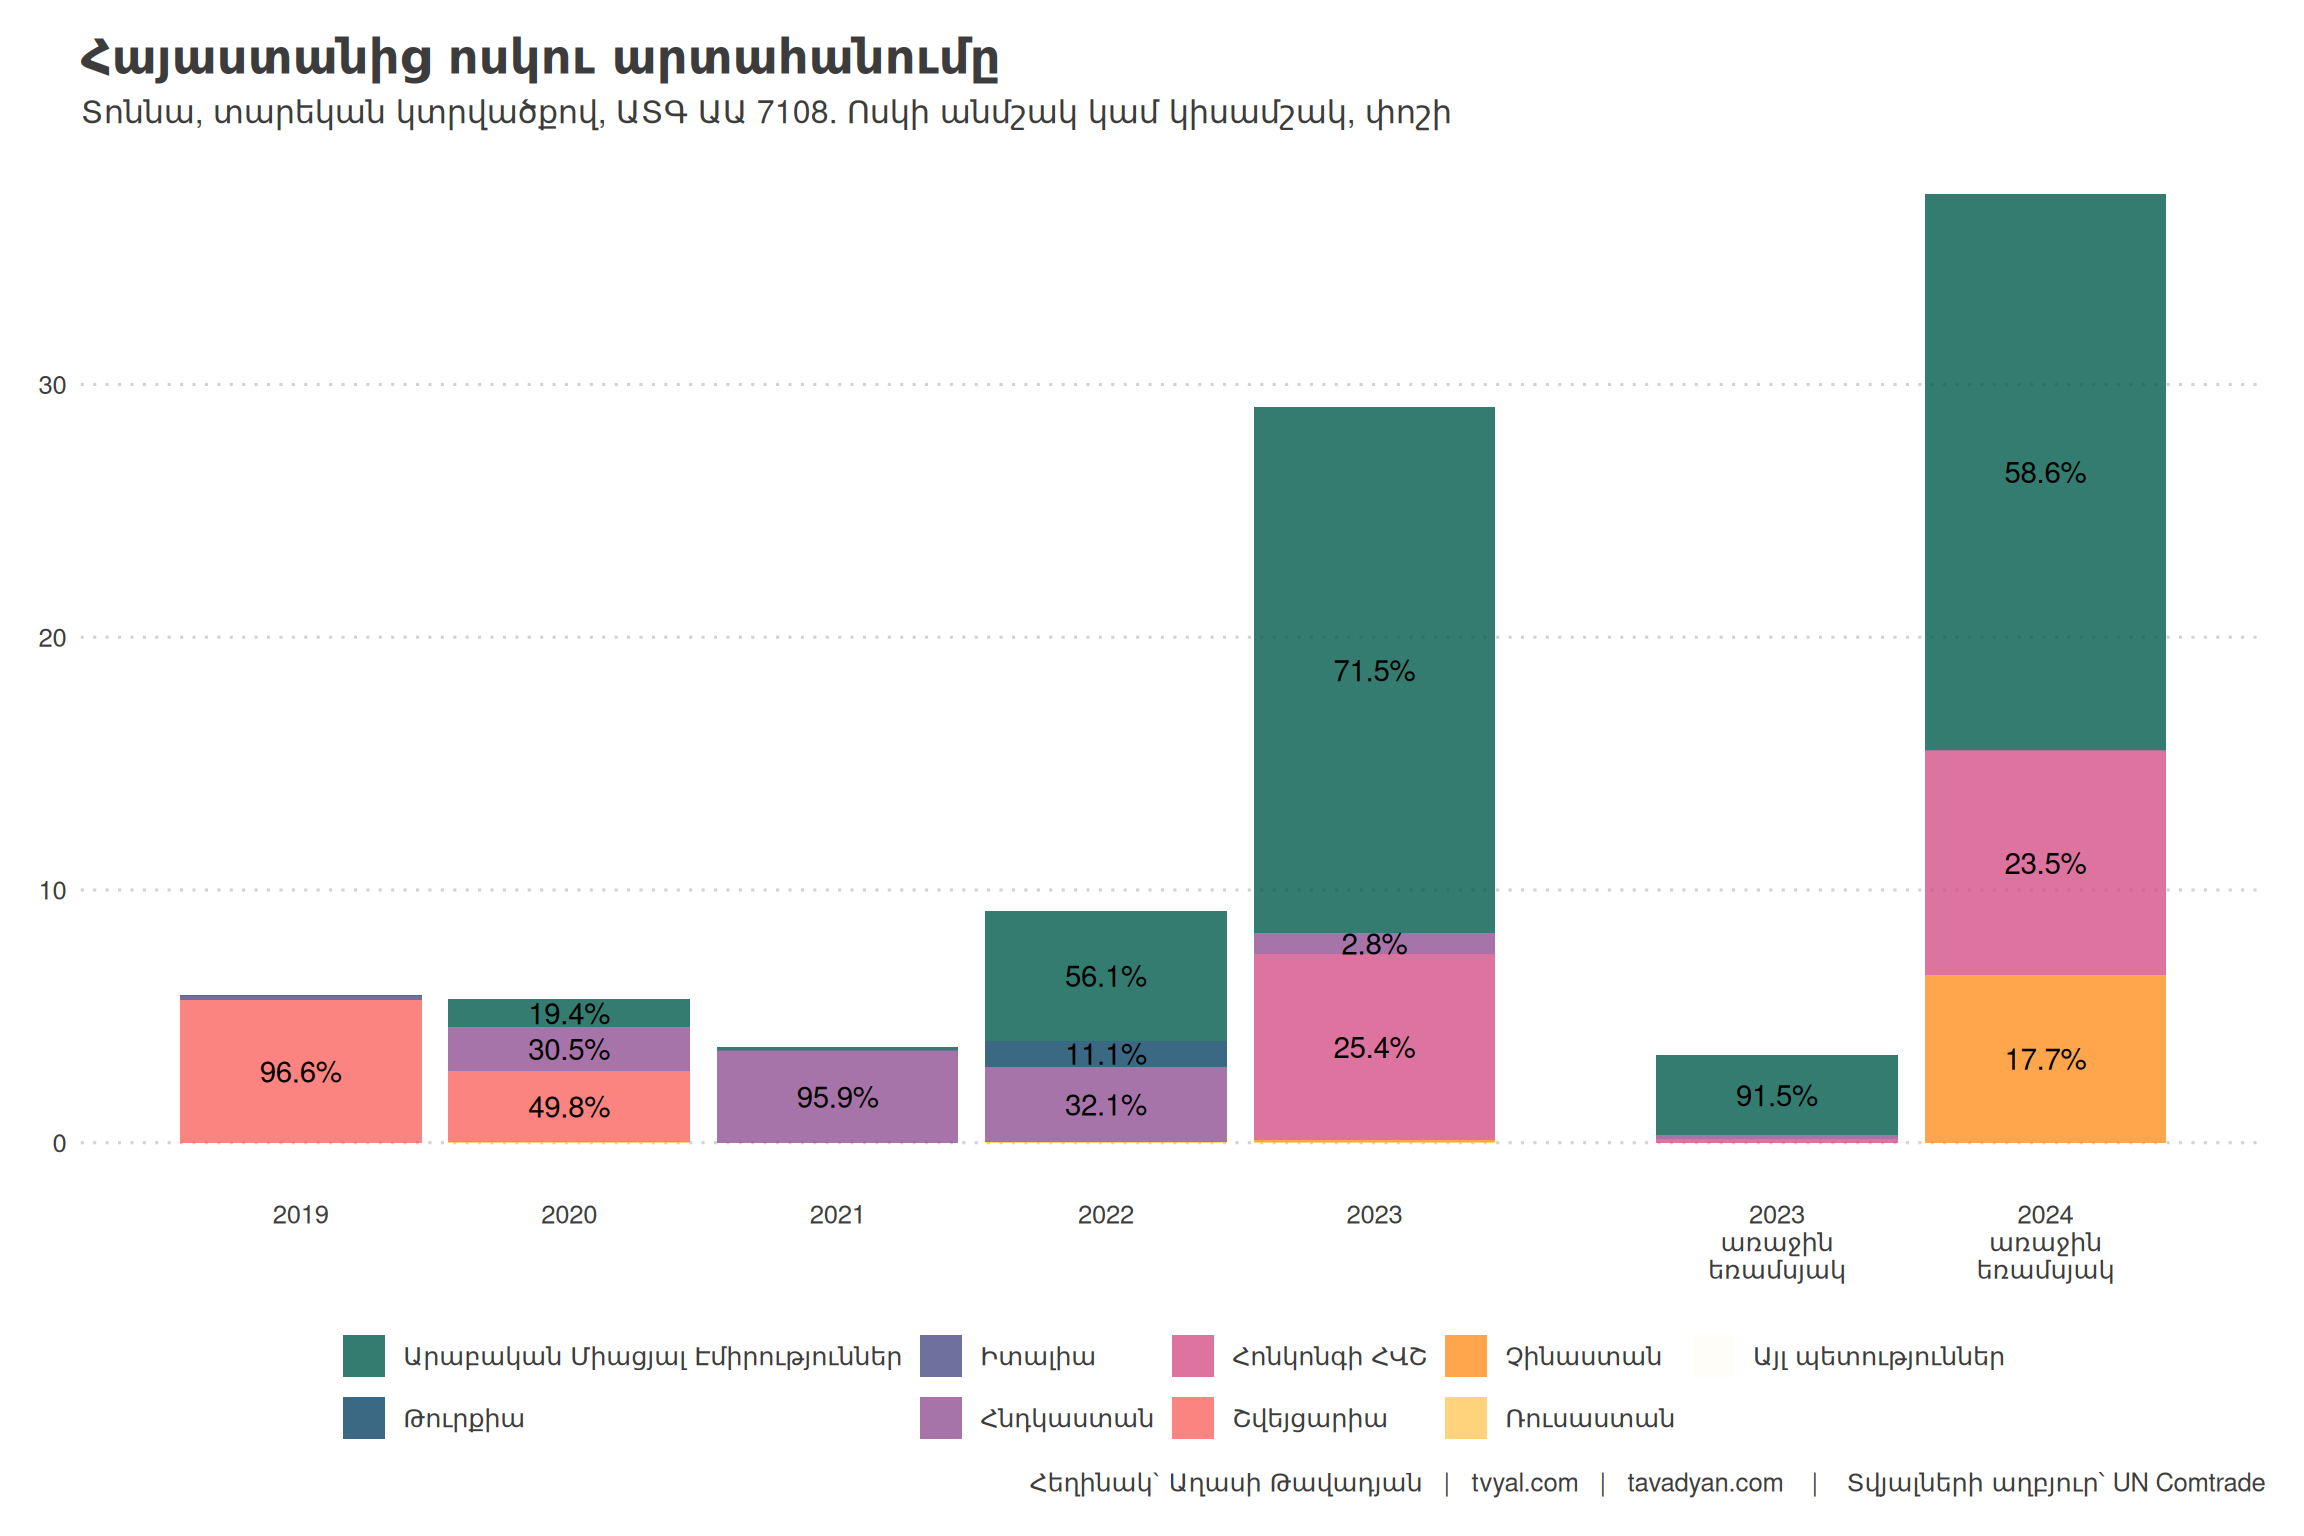
The change is evident. If in 2019 Switzerland was the main destination for Armenia’s gold exports (96.6% of exports), then in 2023 the United Arab Emirates became the dominant recipient (71.5%), followed by Hong Kong (25.4%).
This realignment becomes more apparent in the first quarter of 2024. During this period, the United Arab Emirates received 58.6% of Armenia’s gold exports, while China and Hong Kong combined received 41.2%. Overall, 14.1 tons of gold, worth about 938.4 million USD, were exported to Greater China (mainland China and Hong Kong) in just the first three months of 2024.
It is important to note that this surge in gold exports is largely responsible for Armenia’s recent economic growth figures. As we wrote in our May 11, 2024 newsletter, 76% of Armenia’s overall exports now consist of precious and semi-precious metals and stones (HS code 71). The export of this commodity increased almost ninefold in the first quarter of 2024 compared to the same period in 2023.
However, this growth masks worrying trends in other sectors. Our previous analysis showed that exports of traditional goods have actually declined. The surge in gold re-exports effectively masks a downward trend in other sectors of the economy.
Part 3. Discrepancies in Armenia’s Gold Trade Data
To analyze pricing trends in Armenia’s gold trade, we applied a simple but effective methodology. We calculated the price of gold per gram by dividing the total trade value in USD by the net weight in kilograms for both imports and exports. This approach corresponds to standard practices in international trade analysis and allows for direct comparison with global market prices (Farchy and Meyer, 2019).
Chart 5.
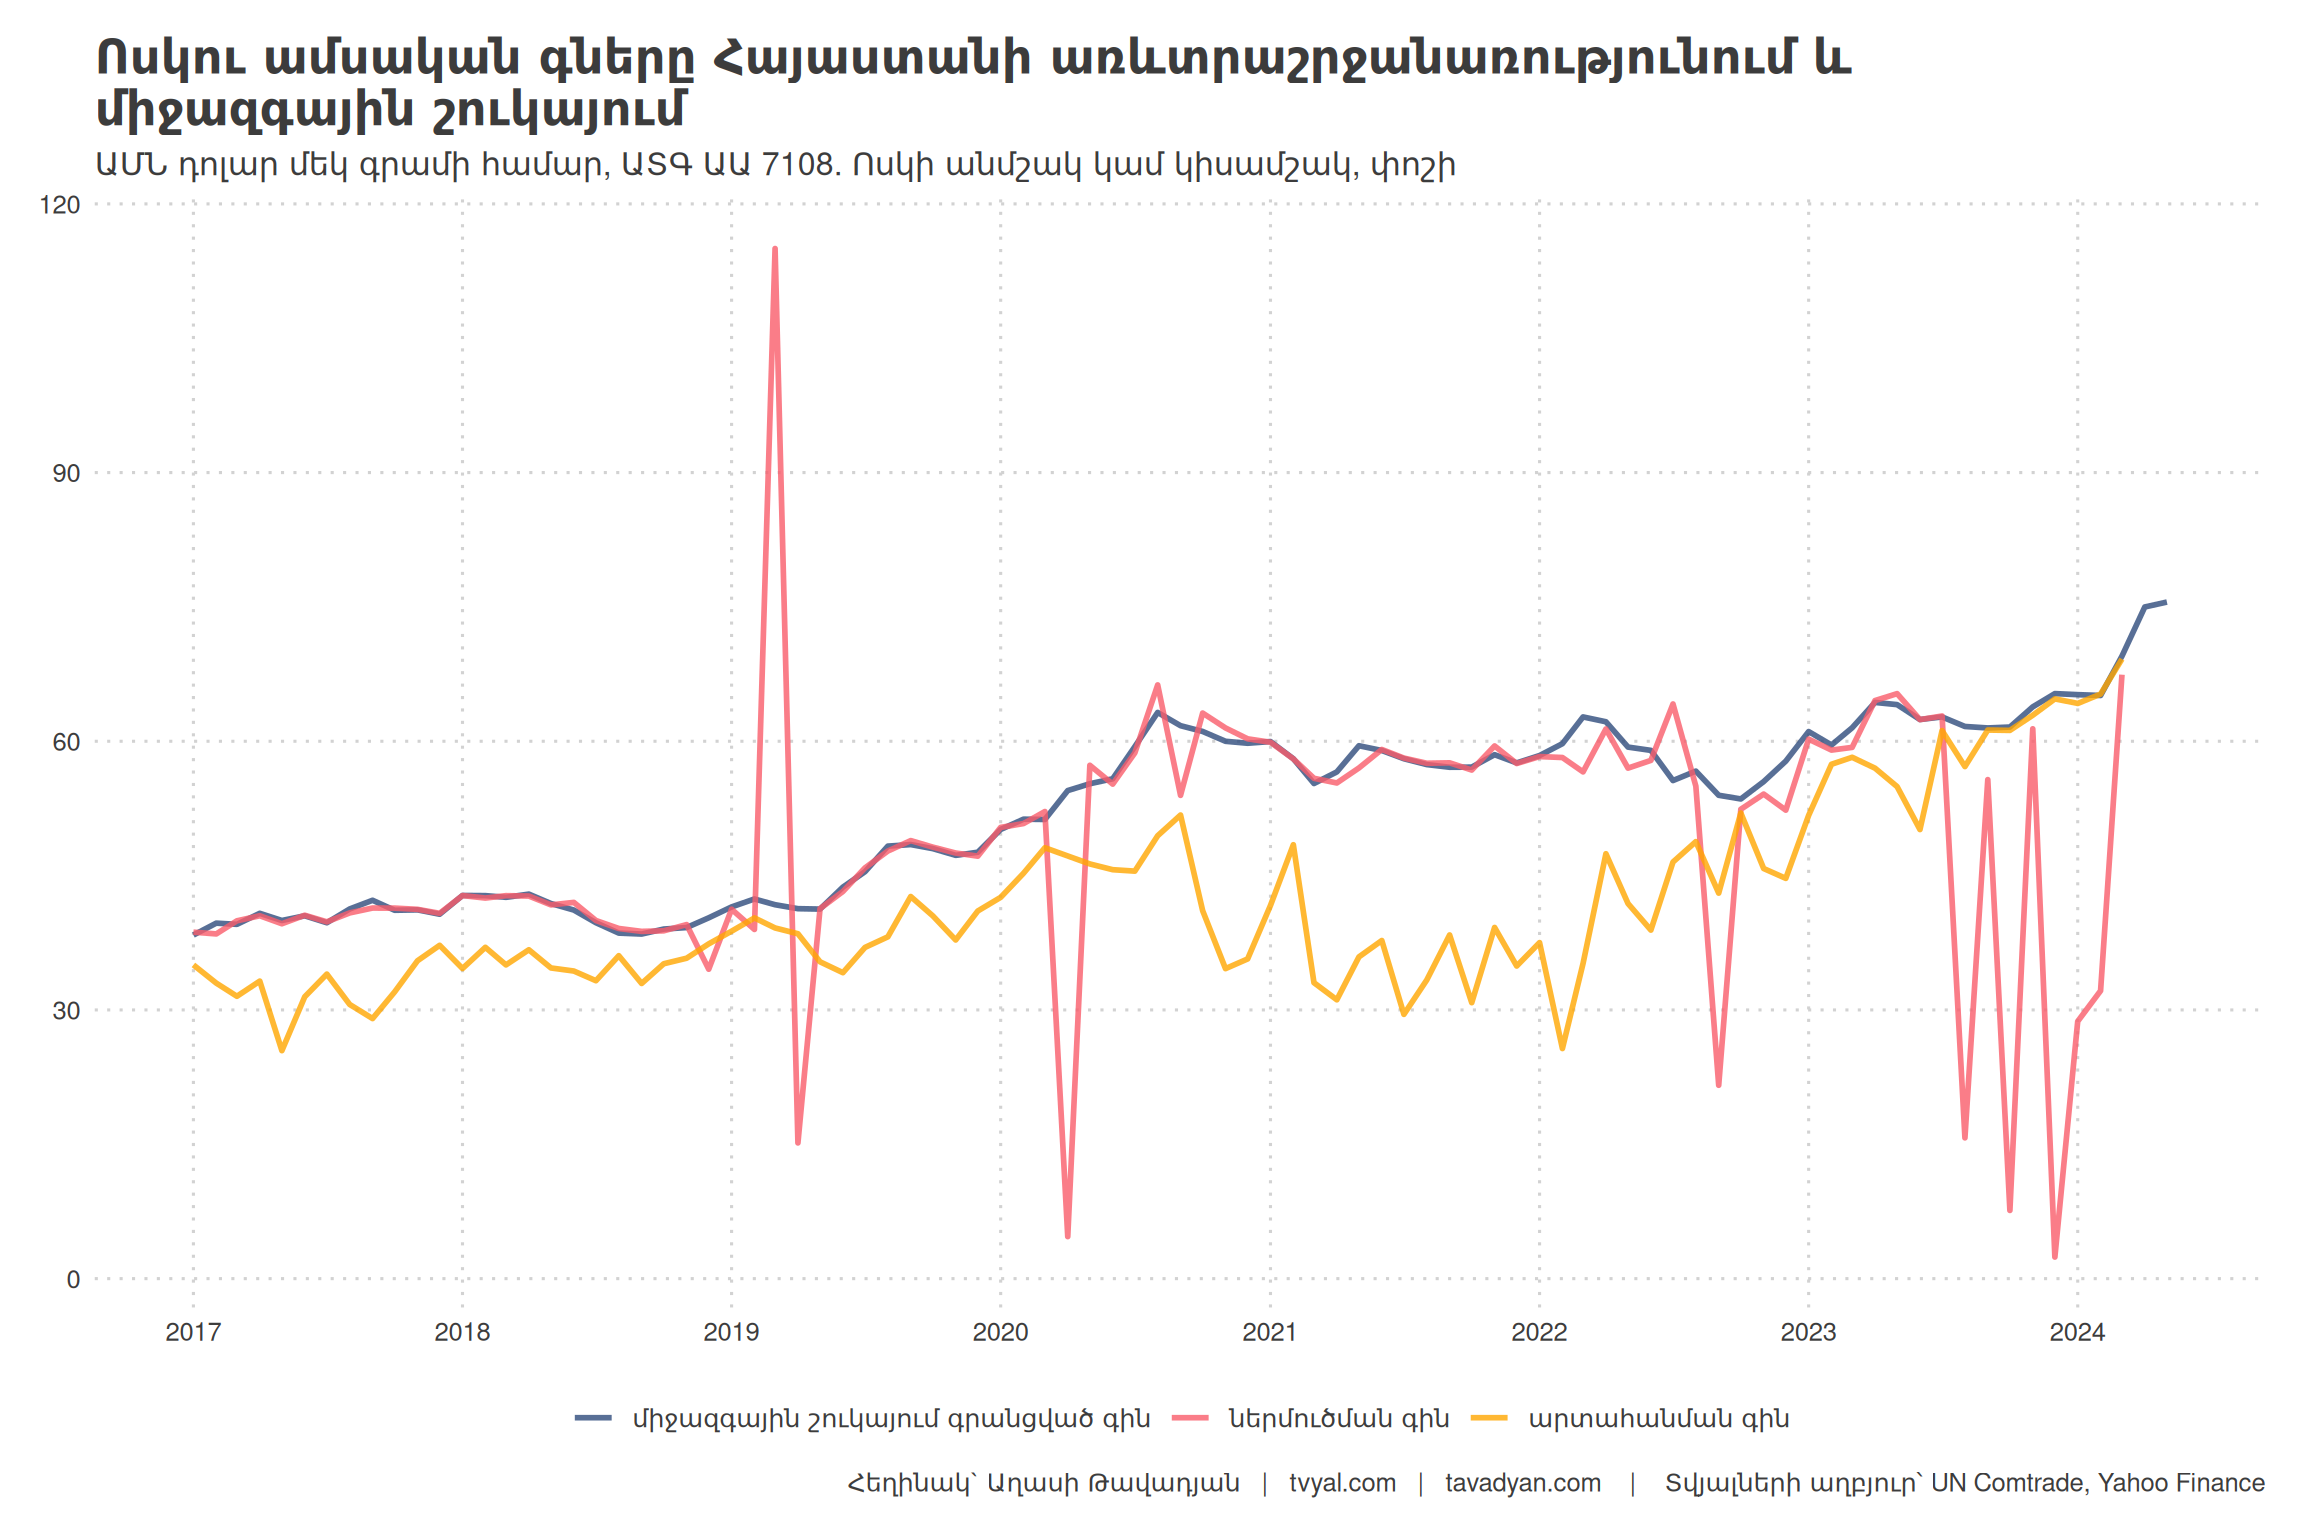
Chart 5 shows the results of this analysis, revealing a number of remarkable patterns and anomalies:
- Consistency with international prices: Until August 2023, the price of imported gold generally tracked international market trends. This correlation is expected in a functioning market and suggests that Armenia’s gold imports were largely consistent with global valuations during this period.
- Global gold price growth: The chart shows a significant increase in the price of gold over the past year. This is due to a number of factors, including the search for alternative means of payment against the US dollar and the use of gold by BRICS countries as an alternative to the dollar (Savage, 2023).
- Gold import price discrepancies: Official data shows a number of disturbing discrepancies, especially in recent months when the global market price of gold per gram is around 74 USD:
- August 2023: Armenia’s gold import price was 15.72 USD per gram,
- October 2023: It was 7.62 USD per gram,
- December 2023: It reached an unprecedented low of 2.41 USD per gram,
- January 2024: It was 28.73 USD per gram.
The figure for December 2023 is particularly noteworthy. Official statistics indicate that during that month, 192 tons of gold were imported into Armenia at a value of just 2.41 USD per gram. This volume is exceptionally large for a country the size of Armenia, and the price is significantly lower than any reasonable market price for gold.
These discrepancies raise a number of important questions:
- Data integrity: Could these figures be the result of statistical errors or misreporting? If so, what are the implications for the reliability of Armenia’s trade statistics?
- Valuation methods: Have there been significant changes in the methods of valuing gold imports? What factors could explain such extreme price fluctuations?
- Trade practices: Do these figures reflect changes in Armenia’s gold trade practices or partners? Are there new types of gold-related products being imported that could explain the price anomalies?
- Regulatory oversight: What role do Armenia’s customs and financial regulators play in monitoring these transactions? Are there adequate mechanisms in place to ensure accurate reporting and valuation?
- Economic implications: How do these discrepancies affect Armenia’s trade balance and overall economic indicators? What are the potential consequences for economic policy and international trade relations?
- Transparency issues: Given the strategic importance of gold in international finance, what steps can be taken to enhance the transparency of reporting on Armenia’s gold trade?
Conclusion
The drastic change in gold trade patterns involving Russia and Armenia raises numerous questions about the nature and consequences of these transactions. Although officially recorded as exports from Armenia, these gold flows are primarily re-exports of Russian gold to other countries, specifically to the United Arab Emirates and China.
This phenomenon has significant implications for understanding Armenia’s economic performance and its position in international trade networks. The concentration of exports on a single, high-value commodity presents both opportunities and risks for Armenia’s economic future.
As Armenia’s role in the global gold trade continues to evolve, it is important to monitor how this affects the country’s broader economic indicators and international financial relations. The extreme fluctuations in reported prices and volumes not only raise concerns about data accuracy but also have significant implications for economic analysis, policymaking, and international trade relations.
Methodology
In analyzing recent trends in Russian gold exports, we employ a method called “mirror statistics” or “reverse statistics” to overcome data limitations. This approach is widely used by international organizations and researchers when direct export data is unavailable or unreliable.
The UN Statistics Division defines mirror statistics as “the use of partner country import (or export) data to derive the export (or import) data of a given country” (United Nations, 2011). This method is particularly useful for estimating trade flows when a country does not report its own data, as has been the case with Russia since 2022.
Our methodology involves:
- Determining the last available period of direct reporting for each country.
- Using original export data up to that period.
- Estimating subsequent export data using partner country import reports.
This approach is consistent with International Monetary Fund (IMF) recommendations for addressing asymmetries in trade statistics (IMF, 2022) and has been endorsed by the World Bank for filling data gaps in international trade analysis (World Bank, 2021).
It is important to note that while mirror statistics provide valuable estimates, they are not without limitations. Discrepancies can arise due to differences in valuation methods, timing, and classification practices among countries (OECD, 2023).
References
- Pop, V, and Fleming, S. and Politi, P. (2022, April 6). Weaponisation of finance: how the west unleashed ‘shock and awe’ on Russia. Financial Times. https://www.ft.com/content/5b397d6b-bde4-4a8c-b9a4-080485d6c64a
- Chandran, R. (2023, August 24). What is a BRICS currency and is the U.S. dollar in trouble? Reuters. https://www.reuters.com/markets/currencies/what-is-brics-currency-could-one-be-adopted-2023-08-23/
- International Monetary Fund. (2022). Balance of Payments and International Investment Position Manual. https://www.imf.org/-/media/Files/Publications/balance-of-payments-statistics/ABPEA2022001.ashx
- OECD. (2023). The Bilateral Trade Database by Industry and End-Use (BTDIxE). https://www.oecd.org/sti/ind/BTDIxE_2023_metadata.pdf
- United Nations. (2011). International Merchandise Trade Statistics: Concepts and Definitions 2010. https://www.un.org/en/development/desa/publications/international-merchandise-trade-statistics-concepts-and-definitions-2010-imts-2010.html
- World Bank. (2021). World Integrated Trade Solution (WITS) - User Manual. https://wits.worldbank.org/data/public/WITS_User_Manual.pdf
- World Gold Council. (2024). Gold Demand Trends Full Year and Q4
You might also be interested in our previous articles: