Շնորհավոր Ամանոր և Սուրբ Ծնունդ
🎄🎅🎁✨🔔🕯️🦌🎉🍪🥛⛄🌨️🧤🧣🍬🍭
Շնորհակալ եմ, որ հետևում եք մեր գործունեությանը։
Thanks for your time and for hanging with us.

Ամփոփենք տարին
- գրեթե կես տարի՝ 25 շաբաթ, 25 վերլուծություններ ⏳
- ավելի քան 10 հազար տող կոդ 💻
- ավելի քան 50 գծապատկեր 📊
- 950 էլ. փոստի բաժանորդագրվածների ցանկում 📬
Let’s summarize the year
- Almost half a year: 25 weeks, 25 analyses ⏳
- More than 10 thousand lines of code 💻
- More than 50 plots 📊
- 950 subscribed emails 📬
Խնդրում եմ գնահատեք մեր գործունեությունը
Please rate our work

Հաջորդ շաբաթ նյուզլեթեր չի լինի։ Կհանդիպենք հաջորդ տարի։ Բարի հանգստյան օրեր։
ԶԼՄ հաղորդագրություններ
Դիտեք Նվեր Մնացականյանին տված իմ վերջին հարցազրույցը, որտեղ ամփոփում եմ 2023-ը։
Հարցազրույցում շոշափվել են հետևյալ թեմաները։
- Ինչո՞ւ 2023 թվականին Հայաստանում 242 մլրդ դրամով ավել հարկ է հավաքվել։
- Հայաստանի տնտեսությունն աճել է 7 տոկոսով՝ զբոսաշրջություն և ՏՏ լոկոմոտիվներ։
- Շինարարները Ռուսաստանից վերադառնում են Հայաստան. դրամն ամրապնդվում է ռուբլու նկատմամբ։

The Christmas Tree code
Ձեզ ուղարկվող բոլոր վերլուծությունները պատրաստվել են կոդի միջոցով՝ հիմնականում R և markdown ծրագրավորման լեզվով։ Օֆիսային ծրագրեր չեն օգտագործվել հետազոտությունների իրականացման մեջ։ Բոլոր վերլուծությունները առկա են նաև մեր կայքէջում, բոլոր վերլուծությունների կոդը և տվյալները դրված են Github-ում։
🎄 Այսօր առաջին անգամ որոշեցի ձեզ հետ կիսվել նաև կոդով։ Այս պարագայում տոնածառի գծագրման կոդով։ 🎄
Ցանկանում եմ ոգեշնչվեք ու ոգեշնչեք եկող տարի։
The main colors of the Christmas Three and the main parameter
scale_factor, which desides the hight of the three and
ajast everything acordingly.
# Change to adjust the tree height. Provide an odd number to works properly
scale_factor = 15

# defining the colors
tree_colors = c(
  "#A8D185", "#04905E", "#9acd32", "#3D9618", "#8AD378", "#3FD485",
  "#089E79", "#079094", "#2F9B61", "#50C878", "#008000", "#008000"
)

bauble_colours = c(
  "#646F75", "#949399", "#8C9EAA", "#C3C4C6",
  "#9CC6D4", "#CD936D", "#DB7076", "#E04C52"
)

garland_reds <- c(
  "#ff0000", "#ffa07a", "#fa8072", "#ff6347",
  "#cd5c5c", "#ff4500", "#dc143c", "#b22222"
)

green_shades <-
  tibble(
    x = seq(0, scale_factor, by = 1),
    y = scale_factor/2 + 1,
    fill = colorRampPalette(c("#013220", "darkgreen"))(scale_factor + 1)
  )

set.seed(1234)
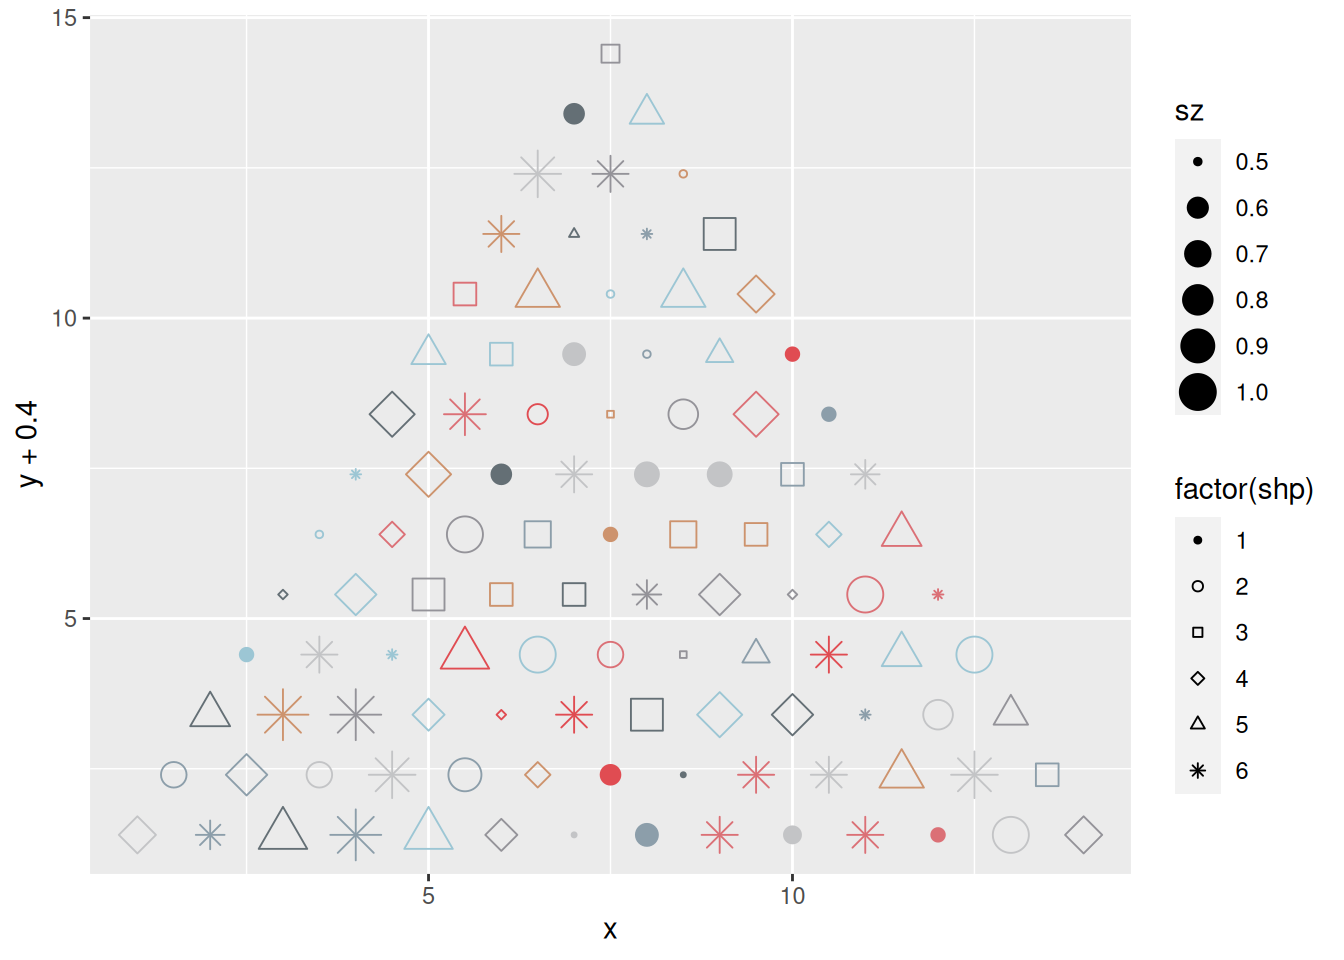
Constructing the Christmas Tree toys (bubbles) database and ploting it.
# Christmas tree bubbles database
bubbles <-
  crossing(
    x = 1:(scale_factor*2),
    y = 1:scale_factor
  ) |>
  filter(
    x %% 2 != y %% 2,
    y <= x,
    y <= -x + max(x)
  ) %>%
  mutate(
    x = x / 2,
    shp = sample(1:6, nrow(.), replace = T),
    sz = sample(seq(0.5, 1, by=0.1), nrow(.), replace = T),
    color = sample(bauble_colours, nrow(.), replace = T),
  )

# Let's see the bubbles in a plot
bubbles |>
  ggplot(aes(x = x, y = y + 0.4, shape = factor(shp), size=sz, color = I(color))) +
  geom_point() +
  scale_shape_manual(values = c(20:24,8))
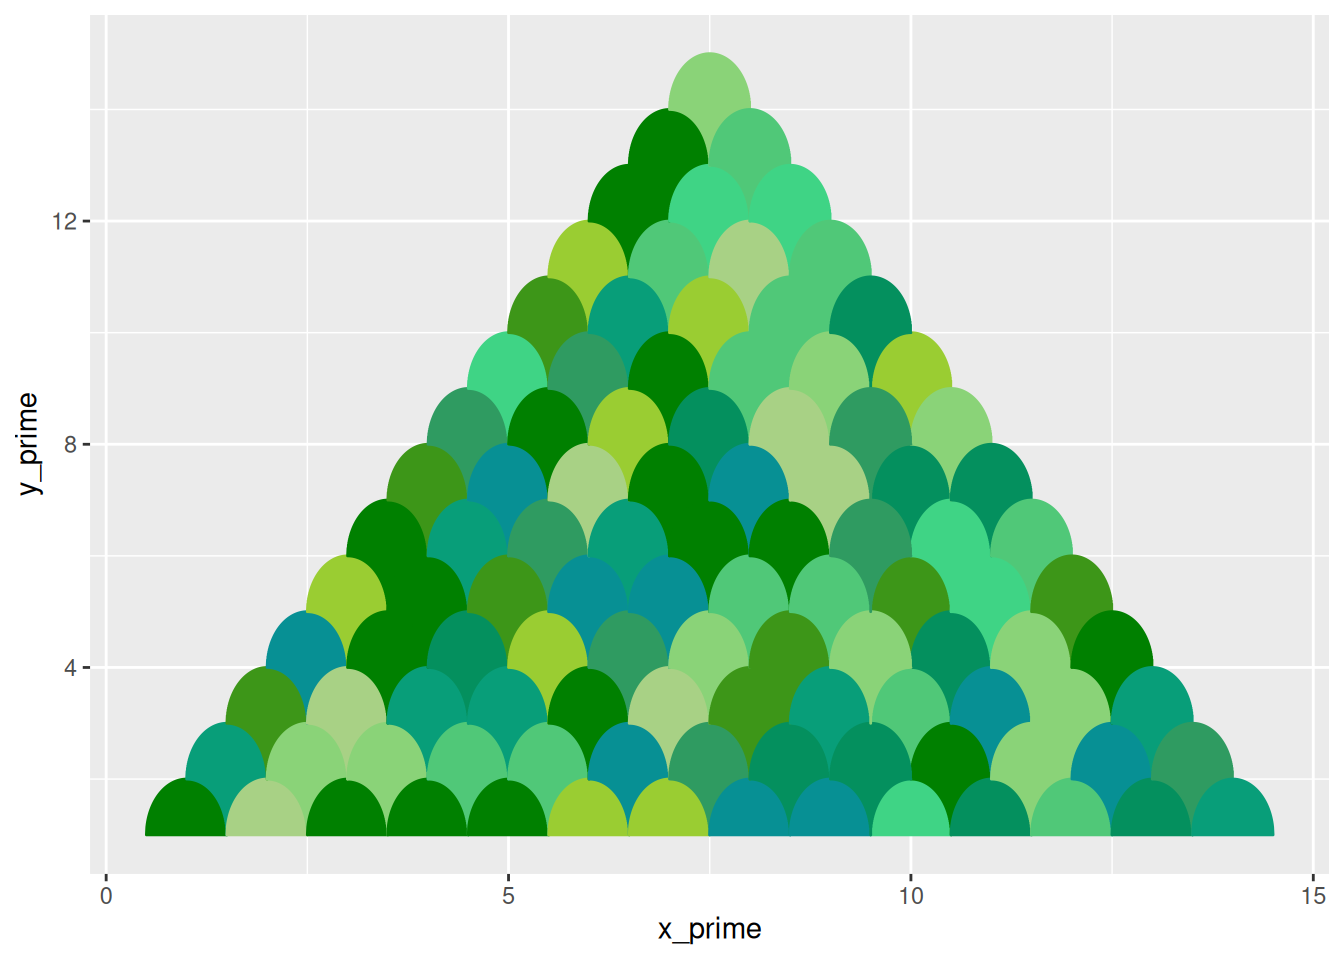
Constructing the three database with geometric scales and the tree
topper. Below is the plot of Christmas three scales. Here the heavy
lifting does the x^2 + y^2 = 1 circle equation:
y_prime = sqrt(1 - x_prime^2).
main_shape_contour <- function(tbl) {
  tbl <-
    tbl |>
    mutate(
      y_prime = sqrt(1 - x_prime^2),
      y_prime2 = ifelse(x_prime >= 0, x_prime - 1, x_prime + 1),
      y_prime2 = sqrt(1 - (y_prime2)^2)-1,
      x_prime = x_prime + x,
      y_prime = y_prime + y,
      y_prime2 = y_prime2 + y,
      x_prime = x_prime / 2,
      x = x / 2,
    ) |>
    pivot_longer(contains("y_prime"), values_to = "y_prime") |>
    filter(y_prime >= 1)

  return(tbl)
}

main_tree <-
  crossing(
    x = 1:(scale_factor*2),
    y = 1:scale_factor,
    x_prime = seq(-1, 1 , 0.01)
  ) |>
  filter(
    x %% 2 != y %% 2,
    y <= x,
    y <= -x + max(x)
  ) %>%
  mutate(
      color = sample(tree_colors, nrow(.), replace = TRUE)
  ) %>%
  main_shape_contour()

treetopper_data <-
  tibble(
    x = scale_factor,
    y = scale_factor + 1,
    x_prime = seq(-1, 1 , 0.01)
  ) |>
  main_shape_contour() |>
  crossing(
    nesting(
      linetype = as.factor(1:7),
      color = sample(garland_reds, 7)
    )
  )

# Let's see the tree in a plot
main_tree |>
  ggplot(aes(x_prime, y_prime, group = paste(x, y))) +
  geom_polygon(aes(fill = I(color), color = I(color)))

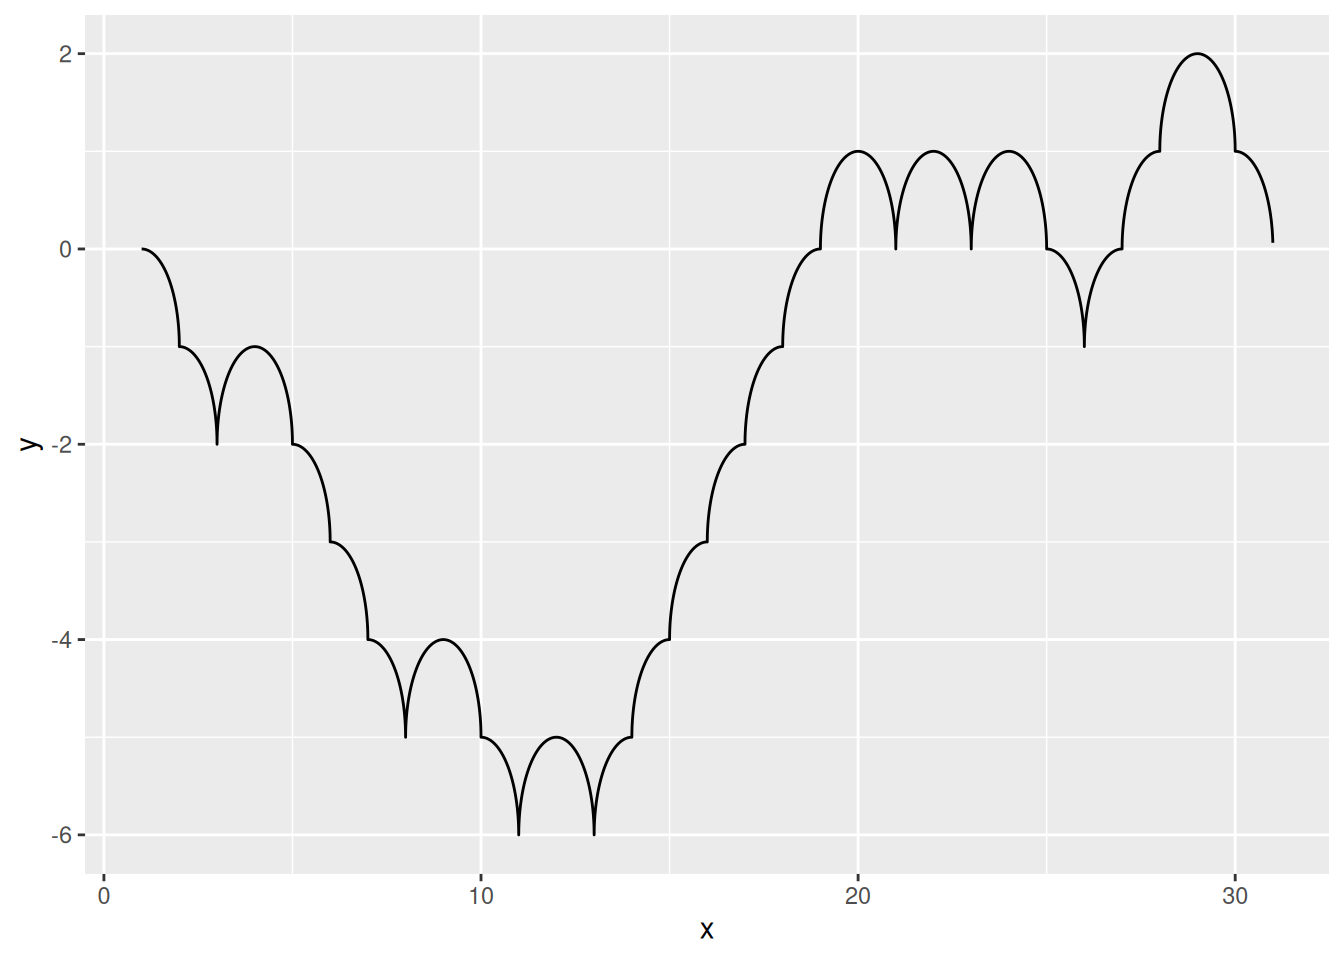
This function was the hardest. It randomly constructs a garland line that mimics the scales of the Tree.
# This function plots a random gerland based on the geometry of the tree
garland <-
  function(len = scale_factor * 2, resalution = 500) {
    j = NULL
    j[1] = 0

    for (i in 1:len) {
      # j[i + 1] = cumsum(j)
      if ((i + sum(j)) %% 2 == 0) {
        j[i + 1] = sample(c(0, 1), size = 1)
      } else{
        j[i + 1] = sample(c(0, -1), size = 1)
      }
    }

    j = tail(j, -1)

    data <-
      tibble(
        x_floor = 1:len,
        y_floor = cumsum(j)
      ) |>
      crossing(x = seq(0, 1 - 1/resalution, 1/resalution)) |>
      mutate(
        x = x_floor + x,
        y = case_when(
          (x_floor + y_floor) %% 2 == 0 ~ sqrt(1 - (x %% x_floor)^2),
          (x_floor + y_floor) %% 2 == 1 ~ sqrt(1 - (x %% x_floor - 1)^2),
        ),
        y = y + y_floor
      ) |>
      select(x,y)

    return(data)
  }

# An exsample of a random garland
garland() |>
  ggplot(aes(x,y)) +
  geom_line()
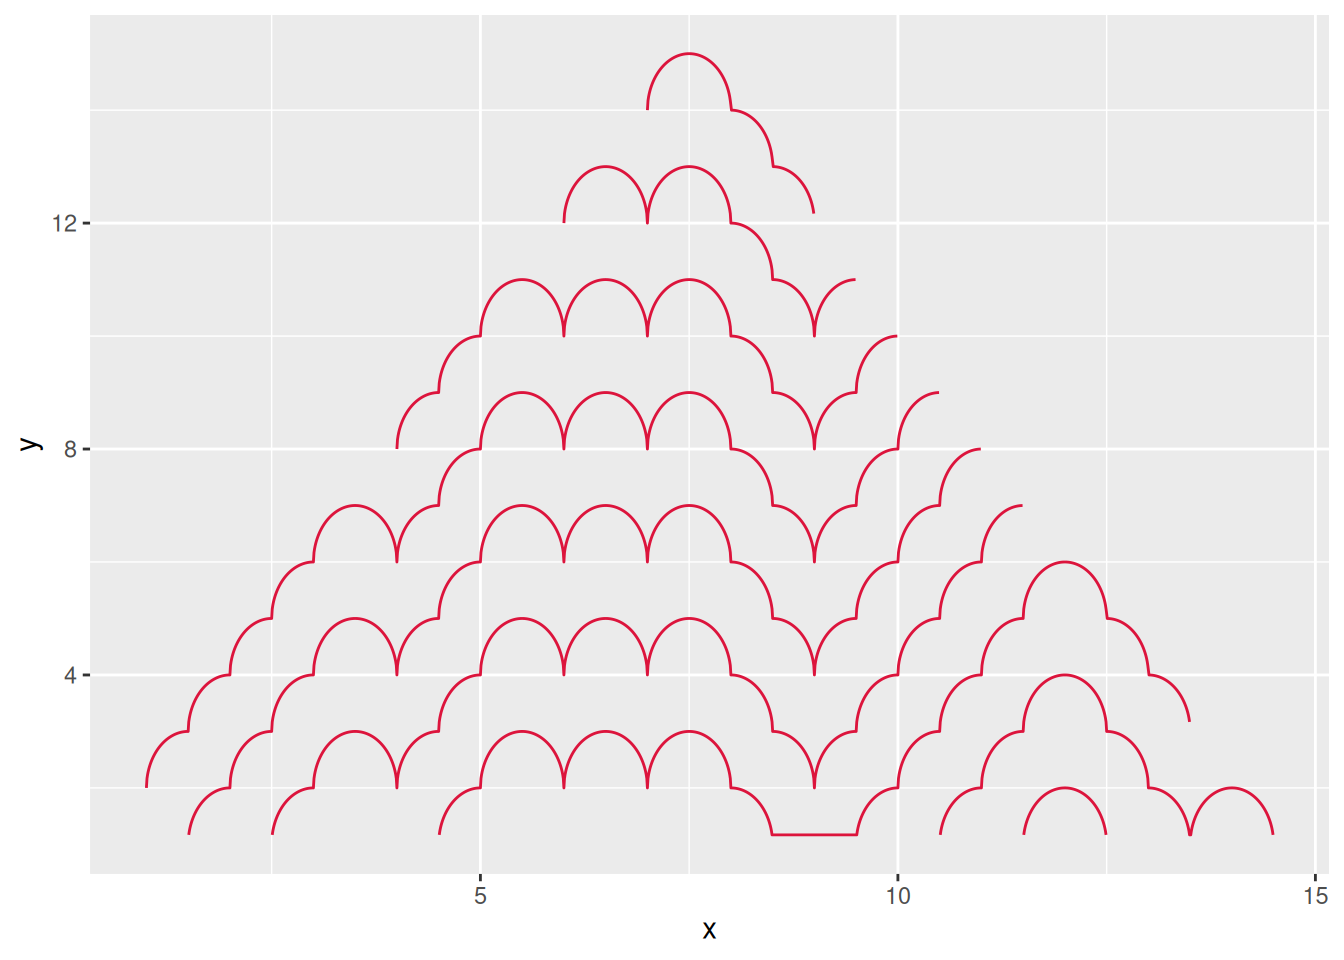
This functin just multiples the said random garland to be drown all over the Three.
garland_multiplayer <-
  function() {

    garland(resalution = 70) |>
      crossing(
        nesting(
          linetype = as.factor(1:7),
          color = sample(garland_reds, 7)
        ),
        nesting(
          hight = seq(-scale_factor, scale_factor * 2, 2),
        )
      ) |>
      arrange(hight) |>
      mutate(
        y = y + hight
      ) |>
      filter(
        y > 1,
        floor(y) <= floor(x),
        floor(y) <= -floor(x) + max(x) - 1
      ) |>
      mutate(x = x /2)
  }

# let's see multiplied garlands
garland_multiplayer() |>
  filter(linetype == "1") |>
  ggplot(aes(x, y, color = I(color), group = hight)) +
  geom_line()
Finialy. Combining everything and animating.
# Combine everything together in a animation

christmas_tree_animation <-
  main_tree |>
  ggplot(aes(x_prime, y_prime, group = paste(x, y))) +
  geom_tile(
    data = green_shades,
    aes(x, y, width = 1, height = scale_factor * 1.266667, fill = I(fill))
  ) +
  geom_tile(aes(x = scale_factor/2, y = 0, width = 2, height = 2), fill = "#b22222") +
  geom_polygon(aes(fill = I(color), color = I(color))) +
  geom_point(
    data = bubbles,
    aes(x = x, y = y + 0.4, shape = factor(shp), size=sz, color = I(color)),
    show.legend = F
  ) +
  geom_line(
    data = garland_multiplayer(),
    aes(
      x, y,
      linetype = as.factor(linetype),
      group = hight, color = I(color)
    ),
    linewidth = 1.8
  ) +
  geom_line(
    data = treetopper_data,
    aes(
      x_prime, y_prime,
      linetype = as.factor(linetype),
      group = paste(x, y), color = I(color)
    ),
    linewidth = 1
  ) +
  labs(
    title = "Merry Christmas & Happy New Year",
    subtitle = NULL,
    caption = "tvyal.com"
  ) +
  scale_shape_manual(values = c(20:24,8)) +
  theme_void() +
  coord_fixed() +
  theme(
    legend.position = "drop",
    plot.background = element_rect(fill="#013220"),
    title = element_text(colour="white"),
    plot.title = element_text(
      size = 30, hjust = 0.5,
      margin = margin(t = 30, unit = "pt")
    ),
    plot.caption = element_text(
      size = 14, hjust = 0.5,
      margin = margin(b = 12, unit = "pt")
    )
  ) +
  transition_states(linetype, transition_length = 2, state_length = 1) +
  enter_fade() +
  exit_fade()
Rendering and saving the animation.
animate(
  christmas_tree_animation,
  nframes = 26,
  width = 600,
  height = 806
)

gganimate::anim_save("christmas_tree_animation.gif")
The end result: